
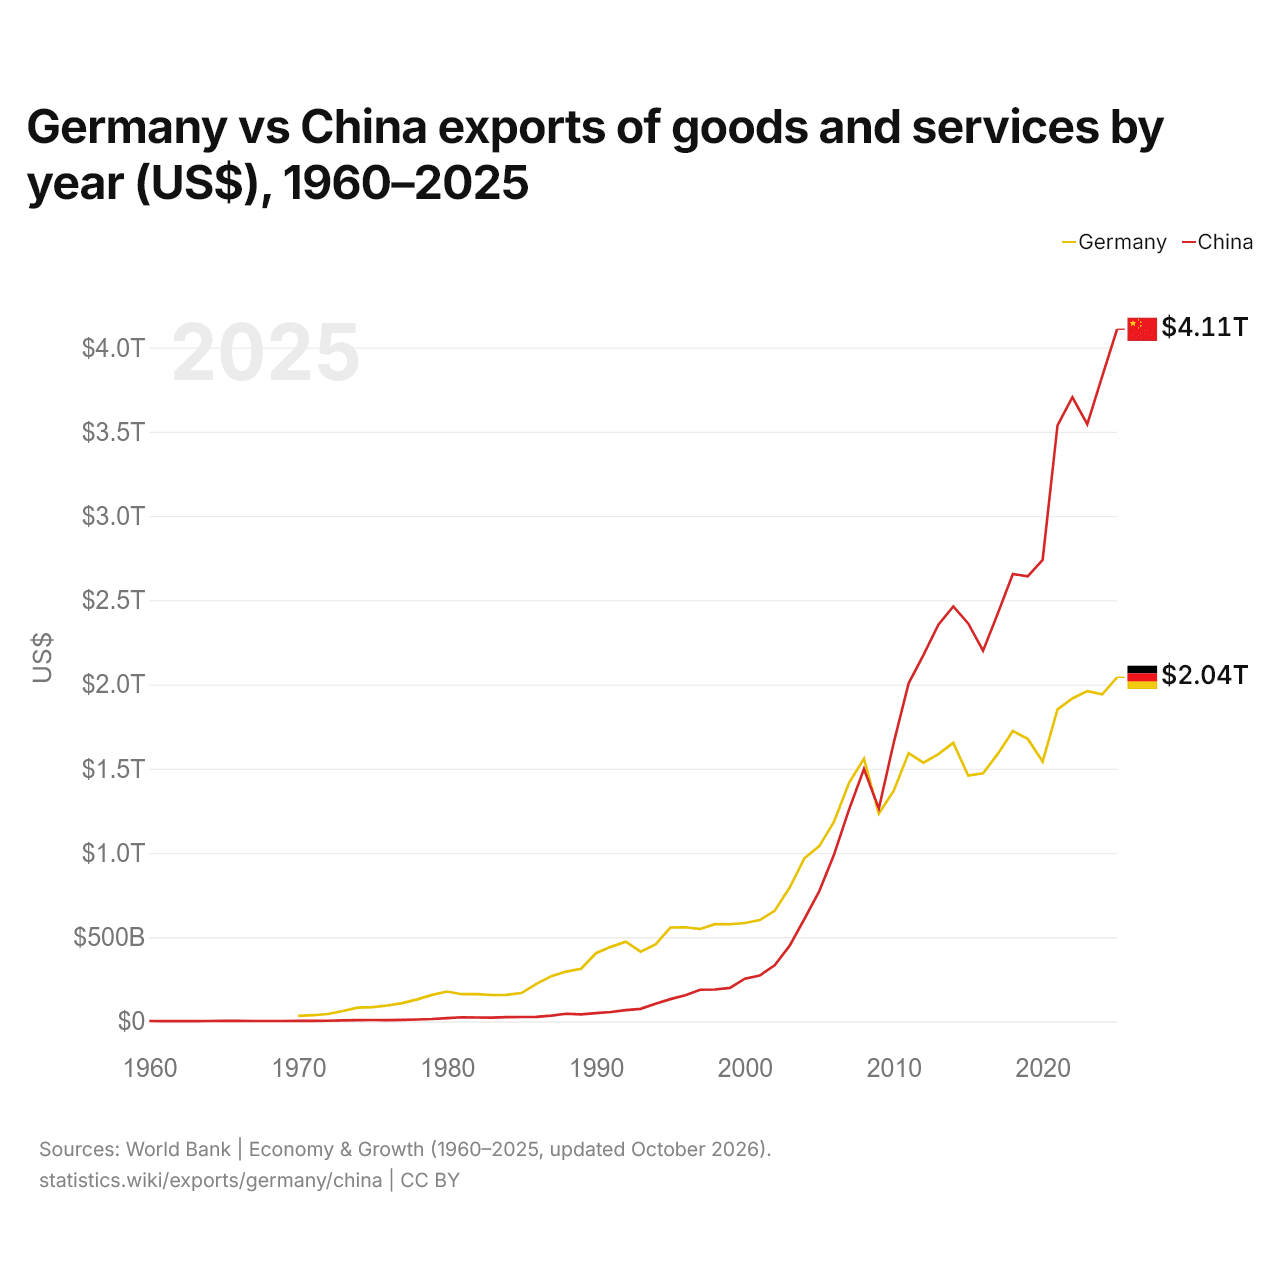
Alemania vs China: exportaciones de bienes y servicios por año (US$), 1960–2025
| Año | US$ | |
|---|---|---|
 Alemania |
 China |
|
| 2025 | 2.042.329.262.308 US$ | 4.108.470.555.118 US$ |
| 2024 | 1.941.431.210.622 US$ | 3.828.873.971.972 US$ |
| 2023 | 1.960.255.682.616 US$ | 3.544.871.083.631 US$ |
| 2022 | 1.916.859.170.749 US$ | 3.705.070.541.733 US$ |
| 2021 | 1.851.846.071.996 US$ | 3.537.510.275.664 US$ |
| 2020 | 1.541.867.660.412 US$ | 2.739.785.089.628 US$ |
| 2019 | 1.676.629.137.012 US$ | 2.641.188.436.776 US$ |
| 2018 | 1.723.433.049.609 US$ | 2.655.609.176.087 US$ |
| 2017 | 1.589.089.750.187 US$ | 2.424.216.052.098 US$ |
| 2016 | 1.472.560.807.846 US$ | 2.199.974.853.570 US$ |
| 2015 | 1.458.592.274.325 US$ | 2.362.097.053.275 US$ |
| 2014 | 1.653.100.023.449 US$ | 2.462.825.804.851 US$ |
| 2013 | 1.586.778.324.179 US$ | 2.354.264.539.609 US$ |
| 2012 | 1.535.179.851.348 US$ | 2.175.069.254.664 US$ |
| 2011 | 1.592.275.709.232 US$ | 2.006.308.960.976 US$ |
| 2010 | 1.369.340.699.300 US$ | 1.654.823.329.664 US$ |
| 2009 | 1.233.301.486.982 US$ | 1.262.664.161.020 US$ |
| 2008 | 1.559.414.079.162 US$ | 1.497.868.782.940 US$ |
| 2007 | 1.415.809.341.319 US$ | 1.258.056.795.941 US$ |
| 2006 | 1.187.129.764.084 US$ | 991.731.387.761 US$ |
| 2005 | 1.040.265.986.689 US$ | 773.339.005.397 US$ |
| 2004 | 967.940.099.859 US$ | 607.356.934.125 US$ |
| 2003 | 792.550.922.246 US$ | 447.958.253.782 US$ |
| 2002 | 655.732.684.858 US$ | 333.002.310.923 US$ |
| 2001 | 600.934.274.700 US$ | 272.060.010.516 US$ |
| 2000 | 583.812.721.398 US$ | 253.092.089.737 US$ |
| 1999 | 576.268.522.696 US$ | 198.699.399.635 US$ |
| 1998 | 576.778.926.309 US$ | 188.750.394.176 US$ |
| 1997 | 548.072.411.460 US$ | 187.447.040.000 US$ |
| 1996 | 558.519.625.682 US$ | 154.811.877.000 US$ |
| 1995 | 557.027.432.783 US$ | 131.858.826.000 US$ |
| 1994 | 456.474.629.384 US$ | 104.607.445.198 US$ |
| 1993 | 413.275.760.085 US$ | 74.280.328.750 US$ |
| 1992 | 473.020.663.745 US$ | 66.847.400.129 US$ |
| 1991 | 442.049.499.116 US$ | 55.542.659.170 US$ |
| 1990 | 404.361.405.399 US$ | 49.129.758.920 US$ |
| 1989 | 311.798.995.111 US$ | 41.190.793.490 US$ |
| 1988 | 295.364.621.896 US$ | 44.923.701.330 US$ |
| 1987 | 268.359.809.576 US$ | 34.072.853.910 US$ |
| 1986 | 222.600.598.937 US$ | 26.202.580.690 US$ |
| 1985 | 167.947.100.053 US$ | 25.801.403.274 US$ |
| 1984 | 157.450.977.940 US$ | 24.764.305.081 US$ |
| 1983 | 156.299.761.777 US$ | 21.956.304.449 US$ |
| 1982 | 161.985.626.662 US$ | 22.600.124.795 US$ |
| 1981 | 161.088.263.090 US$ | 24.369.970.000 US$ |
| 1980 | 176.861.953.949 US$ | 19.405.720.000 US$ |
| 1979 | 157.013.153.345 US$ | 13.962.640.000 US$ |
| 1978 | 130.525.539.435 US$ | 10.801.140.000 US$ |
| 1977 | 107.912.072.770 US$ | 8.271.070.000 US$ |
| 1976 | 93.878.705.142 US$ | 7.440.600.000 US$ |
| 1975 | 83.906.542.650 US$ | 7.974.570.000 US$ |
| 1974 | 81.166.870.985 US$ | 7.213.067.000 US$ |
| 1973 | 61.138.960.117 US$ | 5.959.279.000 US$ |
| 1972 | 43.607.225.051 US$ | 3.537.210.000 US$ |
| 1971 | 36.378.984.554 US$ | 2.710.416.000 US$ |
| 1970 | 32.635.821.087 US$ | 2.274.220.000 US$ |
| 1969 | - | 2.214.390.000 US$ |
| 1968 | - | 2.114.700.000 US$ |
| 1967 | - | 2.155.880.000 US$ |
| 1966 | - | 2.370.600.000 US$ |
| 1965 | - | 2.246.600.000 US$ |
| 1964 | - | 1.938.860.000 US$ |
| 1963 | - | 1.666.350.000 US$ |
| 1962 | - | 1.505.370.000 US$ |
| 1961 | - | 1.505.610.000 US$ |
| 1960 | - | 1.883.060.000 US$ |
En 2025, las exportaciones de bienes y servicios de Alemania fueron de 2,04 billones de US$ y las de China, de 4,11 billones de US$: las de China fueron 2,0 veces mayores. En 1970, las exportaciones de Alemania fueron 14 veces mayores: 32,6 mil millones de US$ de Alemania y 2,27 mil millones de US$ de China.
Las exportaciones de bienes y servicios de China han sido mayores que las de Alemania todos los años desde 2009.
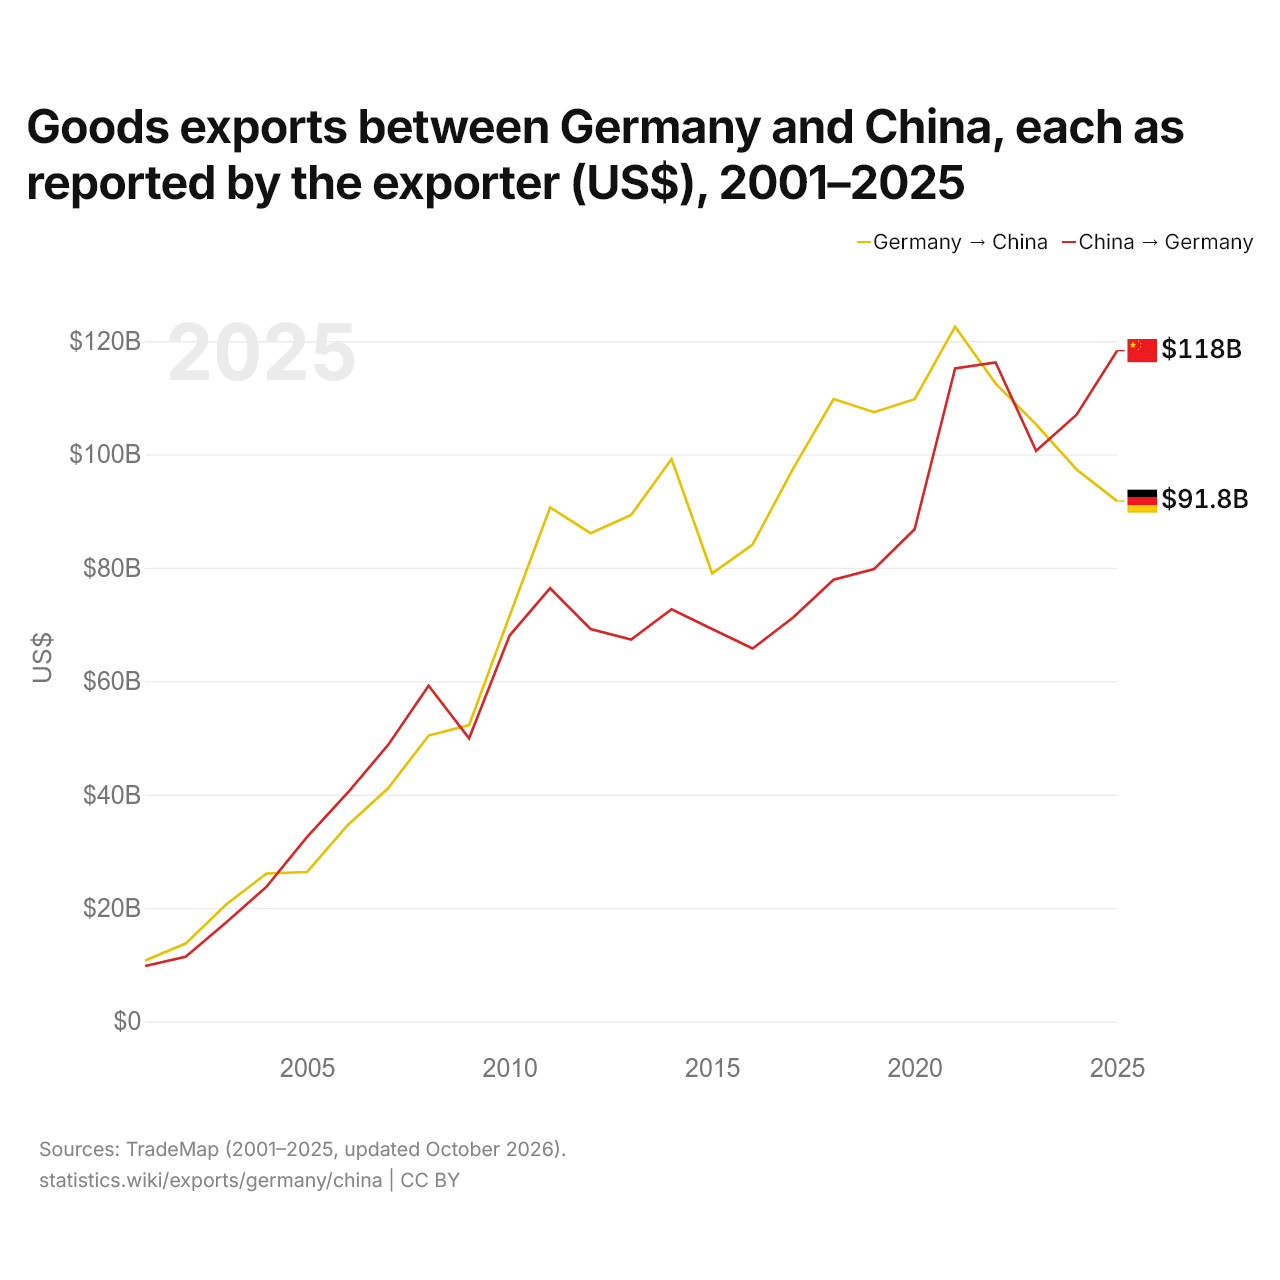
Exportaciones de bienes entre Alemania y China, según declara el exportador (US$), 2001–2025
| Año | US$ | |
|---|---|---|
| Alemania → China | China → Alemania | |
| 2025 | 91.770.879.000 US$ | 118.302.858.000 US$ |
| 2024 | 97.346.111.000 US$ | 107.010.735.000 US$ |
| 2023 | 105.296.206.000 US$ | 100.633.111.000 US$ |
| 2022 | 112.518.867.000 US$ | 116.226.632.000 US$ |
| 2021 | 122.543.344.000 US$ | 115.181.923.000 US$ |
| 2020 | 109.741.467.000 US$ | 86.807.061.000 US$ |
| 2019 | 107.451.431.000 US$ | 79.789.085.000 US$ |
| 2018 | 109.780.291.000 US$ | 77.908.711.000 US$ |
| 2017 | 97.505.540.000 US$ | 71.224.289.000 US$ |
| 2016 | 84.115.719.000 US$ | 65.768.897.000 US$ |
| 2015 | 79.028.920.000 US$ | 69.216.821.000 US$ |
| 2014 | 99.201.360.000 US$ | 72.703.049.000 US$ |
| 2013 | 89.316.350.000 US$ | 67.342.500.000 US$ |
| 2012 | 86.102.711.000 US$ | 69.212.732.000 US$ |
| 2011 | 90.642.574.000 US$ | 76.399.999.000 US$ |
| 2010 | 71.552.785.000 US$ | 68.047.133.000 US$ |
| 2009 | 52.262.376.000 US$ | 49.919.564.000 US$ |
| 2008 | 50.408.742.000 US$ | 59.208.951.000 US$ |
| 2007 | 41.106.431.000 US$ | 48.744.144.000 US$ |
| 2006 | 34.596.026.000 US$ | 40.314.598.000 US$ |
| 2005 | 26.339.982.000 US$ | 32.527.131.000 US$ |
| 2004 | 26.071.490.000 US$ | 23.755.732.000 US$ |
| 2003 | 20.620.293.000 US$ | 17.442.112.000 US$ |
| 2002 | 13.710.968.000 US$ | 11.371.850.000 US$ |
| 2001 | 10.714.927.000 US$ | 9.751.100.000 US$ |
En 2025, las exportaciones de bienes de Alemania hacia China, según Alemania, fueron de 91,8 mil millones de US$, y las de China hacia Alemania, según China, de 118 mil millones de US$: un 29 % más desde China. En 2001, fueron de 10,7 mil millones de US$ desde Alemania y de 9,75 mil millones de US$ desde China.
Alemania vs China: cifras de exportaciones
|
Alemania
|
China
|
|
|---|---|---|
| Exportaciones | 2,04 B US$ (2025) | 4,11 B US$ (2025) |
| Puesto mundial | 3/176 | 1/176 |
| Porcentaje del mundo | 5,85 % | 11,8 % |
| % del PIB | 40,4 % | 21,1 % |
| Mayor categoría de bienes | Maquinaria, electrónica y vehículos (51,8 %, 2025) | Maquinaria, electrónica y vehículos (53,9 %, 2025) |
| Principal destino de bienes | Estados Unidos (9,38 %, 2025) | Estados Unidos (11,1 %, 2025) |
Comparar las exportaciones de 2 países cualesquiera
Fuentes:
- Banco Mundial | Economía y crecimiento (1960–2025, actualizado en octubre de 2026)
- TradeMap (2001–2025, actualizado en octubre de 2026)
Creative Commons Atribución (CC BY): puedes copiar, compartir, adaptar y reutilizar este contenido, también con fines comerciales, siempre que cites a statistics.wiki e indiques los cambios que hayas hecho. Las fuentes indicadas arriba pueden tener sus propias condiciones de licencia.