
Chile vs Bolivia: exportaciones de bienes y servicios por año (US$), 1960–2025
| Año | US$ | |
|---|---|---|
 Chile |
 Bolivia |
|
| 2025 | 123.520.198.503 US$ | - |
| 2024 | 111.066.428.902 US$ | 11.763.846.802 US$ |
| 2023 | 103.343.502.222 US$ | 11.725.676.874 US$ |
| 2022 | 107.256.627.766 US$ | 14.163.562.909 US$ |
| 2021 | 100.881.456.526 US$ | 11.276.448.090 US$ |
| 2020 | 79.592.398.711 US$ | 7.139.077.207 US$ |
| 2019 | 77.571.036.969 US$ | 9.834.601.158 US$ |
| 2018 | 84.405.337.955 US$ | 9.854.706.136 US$ |
| 2017 | 78.238.304.190 US$ | 8.973.701.187 US$ |
| 2016 | 69.624.959.647 US$ | 8.311.504.863 US$ |
| 2015 | 70.773.875.084 US$ | 10.186.598.886 US$ |
| 2014 | 85.665.253.039 US$ | 14.285.068.712 US$ |
| 2013 | 89.009.023.666 US$ | 13.518.462.721 US$ |
| 2012 | 90.376.117.071 US$ | 12.774.727.337 US$ |
| 2011 | 94.745.538.460 US$ | 10.565.767.133 US$ |
| 2010 | 82.271.077.297 US$ | 8.093.221.340 US$ |
| 2009 | 63.756.458.033 US$ | 6.194.300.356 US$ |
| 2008 | 74.049.222.066 US$ | 7.487.843.217 US$ |
| 2007 | 77.844.966.314 US$ | 5.483.635.309 US$ |
| 2006 | 67.484.496.355 US$ | 4.783.631.931 US$ |
| 2005 | 49.132.371.504 US$ | 3.394.535.859 US$ |
| 2004 | 39.319.047.777 US$ | 2.731.911.668 US$ |
| 2003 | 26.819.043.116 US$ | 2.069.153.669 US$ |
| 2002 | 22.665.229.050 US$ | 1.710.308.633 US$ |
| 2001 | 22.794.630.056 US$ | 1.626.035.911 US$ |
| 2000 | 23.598.874.231 US$ | 1.534.686.673 US$ |
| 1999 | 21.395.654.975 US$ | 1.398.593.388 US$ |
| 1998 | 20.615.225.914 US$ | 1.673.894.695 US$ |
| 1997 | 22.188.168.722 US$ | 1.673.170.826 US$ |
| 1996 | 20.392.925.082 US$ | 1.670.369.478 US$ |
| 1995 | 21.024.502.601 US$ | 1.514.364.435 US$ |
| 1994 | 15.653.663.029 US$ | 1.295.730.954 US$ |
| 1993 | 12.755.908.986 US$ | 1.094.224.544 US$ |
| 1992 | 13.307.830.022 US$ | 1.131.356.484 US$ |
| 1991 | 11.846.241.659 US$ | 1.147.697.877 US$ |
| 1990 | 10.767.995.923 US$ | 1.108.688.419 US$ |
| 1989 | 10.088.686.694 US$ | 1.061.009.896 US$ |
| 1988 | 8.456.927.621 US$ | 862.854.458 US$ |
| 1987 | 6.306.734.128 US$ | 853.524.498 US$ |
| 1986 | 5.162.723.063 US$ | 844.299.281 US$ |
| 1985 | 4.651.072.800 US$ | 1.024.367.606 US$ |
| 1984 | 4.485.352.694 US$ | 1.459.382.832 US$ |
| 1983 | 4.769.390.034 US$ | 1.535.522.169 US$ |
| 1982 | 3.635.010.932 US$ | 1.625.898.083 US$ |
| 1981 | 5.363.825.291 US$ | 1.370.758.564 US$ |
| 1980 | 6.292.627.054 US$ | 1.112.928.222 US$ |
| 1979 | 4.825.253.306 US$ | 1.068.844.960 US$ |
| 1978 | 3.169.461.902 US$ | 849.175.412 US$ |
| 1977 | 2.755.061.055 US$ | 864.117.941 US$ |
| 1976 | 2.475.236.058 US$ | 756.121.939 US$ |
| 1975 | 1.837.775.113 US$ | 623.738.131 US$ |
| 1974 | 3.166.203.510 US$ | 741.229.385 US$ |
| 1973 | 2.238.225.385 US$ | 350.024.988 US$ |
| 1972 | 1.131.291.625 US$ | 265.513.351 US$ |
| 1971 | 1.178.754.034 US$ | 234.343.434 US$ |
| 1970 | 1.312.710.942 US$ | 250.168.350 US$ |
| 1969 | 1.344.218.032 US$ | 189.814.815 US$ |
| 1968 | 985.246.219 US$ | 169.696.970 US$ |
| 1967 | 991.413.773 US$ | 170.033.670 US$ |
| 1966 | 1.027.139.444 US$ | 142.255.892 US$ |
| 1965 | 811.080.139 US$ | 129.713.805 US$ |
| 1964 | 730.563.069 US$ | 110.437.710 US$ |
| 1963 | 687.611.591 US$ | 81.986.532 US$ |
| 1962 | 639.219.282 US$ | 67.929.293 US$ |
| 1961 | 550.751.429 US$ | 67.255.892 US$ |
| 1960 | 536.609.091 US$ | 61.111.111 US$ |
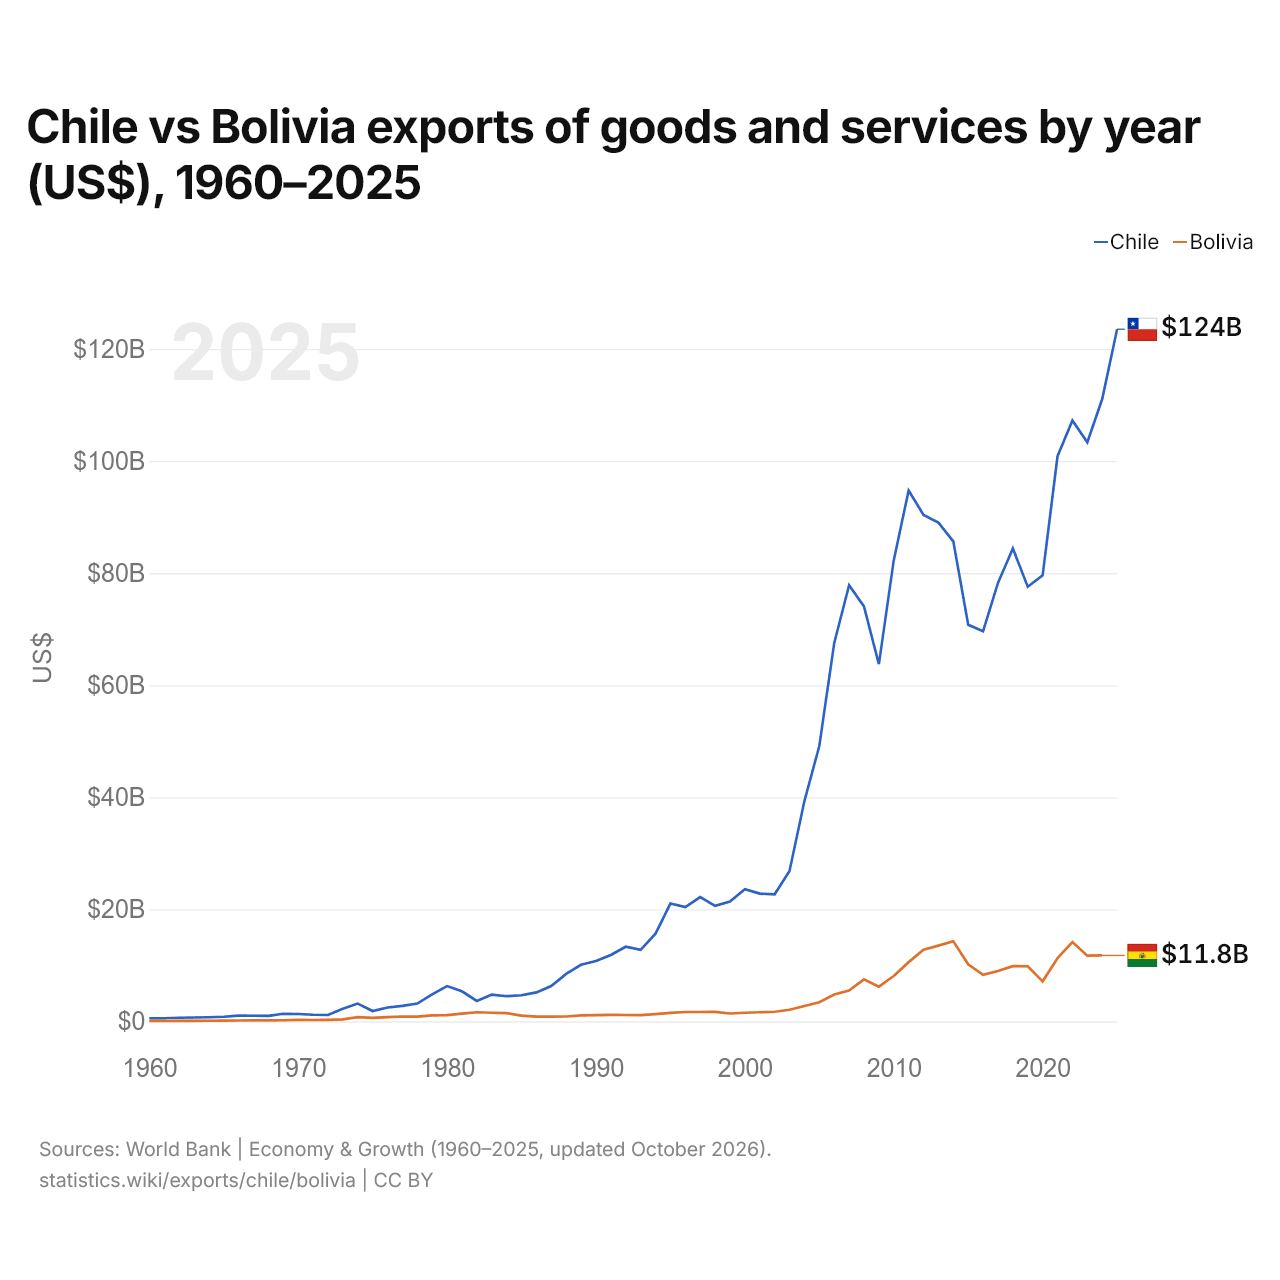
Las exportaciones de bienes y servicios de Chile fueron de 111 mil millones de US$ (2024) y las de Bolivia, de 11,8 mil millones de US$ (2024): las de Chile fueron 9,4 veces mayores. En 1960, las exportaciones de Chile fueron 8,8 veces mayores: 537 millones de US$ de Chile y 61,1 millones de US$ de Bolivia.
Las exportaciones de bienes y servicios de Chile han sido mayores que las de Bolivia todos los años desde 1960.
Exportaciones de bienes entre Chile y Bolivia, según declara el exportador (US$), 2001–2025
| Año | US$ | |
|---|---|---|
| Chile → Bolivia | Bolivia → Chile | |
| 2025 | 352.146.000 US$ | 122.358.000 US$ |
| 2024 | 466.627.000 US$ | 136.114.000 US$ |
| 2023 | 843.546.000 US$ | 179.036.000 US$ |
| 2022 | 535.388.000 US$ | 237.378.000 US$ |
| 2021 | 373.471.000 US$ | 190.216.000 US$ |
| 2020 | 380.138.000 US$ | 141.252.000 US$ |
| 2019 | 408.018.000 US$ | 101.125.000 US$ |
| 2018 | 332.624.000 US$ | 116.514.000 US$ |
| 2017 | 338.939.000 US$ | 99.349.000 US$ |
| 2016 | 375.188.000 US$ | 92.912.000 US$ |
| 2015 | 442.189.000 US$ | 82.699.000 US$ |
| 2014 | 532.949.000 US$ | 106.021.000 US$ |
| 2013 | 512.904.000 US$ | 163.866.000 US$ |
| 2012 | 462.719.000 US$ | 237.855.000 US$ |
| 2011 | 378.041.000 US$ | 157.495.000 US$ |
| 2010 | 307.551.000 US$ | 100.530.000 US$ |
| 2009 | 312.445.000 US$ | 83.604.000 US$ |
| 2008 | 443.445.000 US$ | 86.669.000 US$ |
| 2007 | 325.464.000 US$ | 60.956.000 US$ |
| 2006 | 297.953.000 US$ | 67.972.000 US$ |
| 2005 | 219.771.000 US$ | 39.764.000 US$ |
| 2004 | 145.843.000 US$ | 50.120.000 US$ |
| 2003 | 147.754.000 US$ | 44.001.000 US$ |
| 2002 | 148.499.000 US$ | 32.797.000 US$ |
| 2001 | 165.158.000 US$ | 30.309.000 US$ |
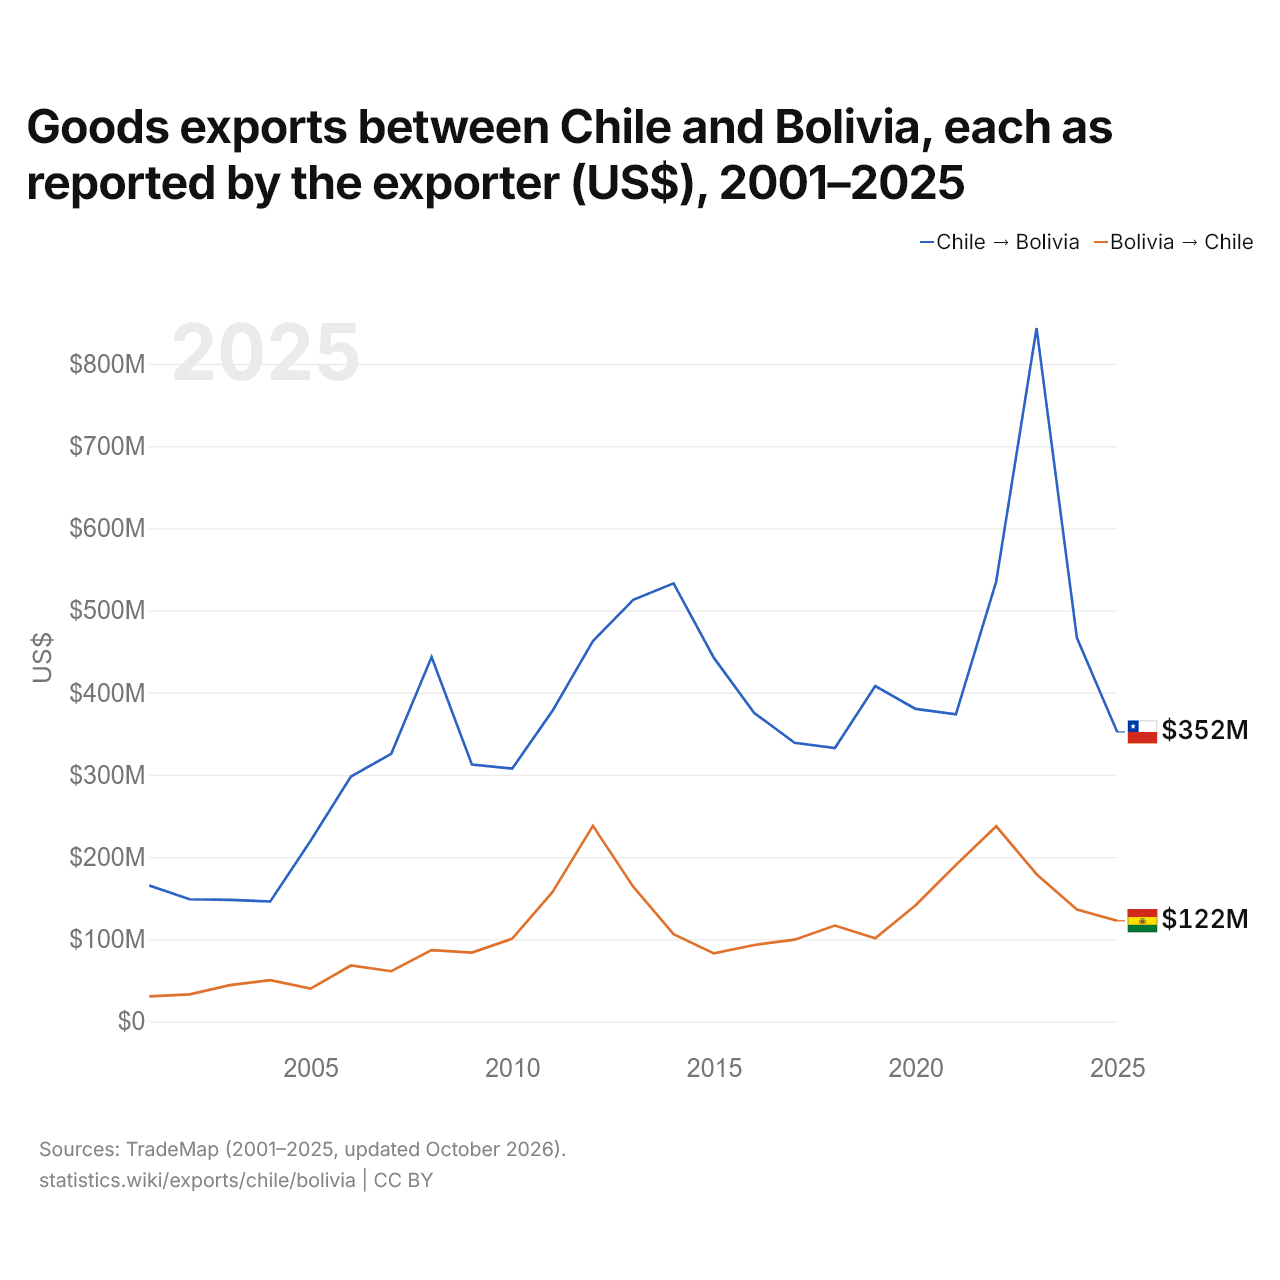
En 2025, las exportaciones de bienes de Chile hacia Bolivia, según Chile, fueron de 352 millones de US$, y las de Bolivia hacia Chile, según Bolivia, de 122 millones de US$: 2,9 veces más desde Chile. En 2001, fueron de 165 millones de US$ desde Chile y de 30,3 millones de US$ desde Bolivia.
Chile vs Bolivia: cifras de exportaciones
|
Chile
|
Bolivia
|
|
|---|---|---|
| Exportaciones | 124 mil M US$ (2025) | 11,8 mil M US$ (2024) |
| Puesto mundial | 44/176 | 106/176 |
| Porcentaje del mundo | 0,35 % | 0,04 % |
| % del PIB | 34,6 % | 21,4 % |
| Mayor categoría de bienes | Petróleo, gas, minerales y otras materias primas (41,2 %, 2025) | Petróleo, gas, minerales y otras materias primas (52,7 %, 2025) |
| Principal destino de bienes | China (35 %, 2025) | China (19,1 %, 2025) |
Comparar las exportaciones de 2 países cualesquiera
Fuentes:
- Banco Mundial | Economía y crecimiento (1960–2025, actualizado en octubre de 2026)
- TradeMap (2001–2025, actualizado en octubre de 2026)
Creative Commons Atribución (CC BY): puedes copiar, compartir, adaptar y reutilizar este contenido, también con fines comerciales, siempre que cites a statistics.wiki e indiques los cambios que hayas hecho. Las fuentes indicadas arriba pueden tener sus propias condiciones de licencia.