
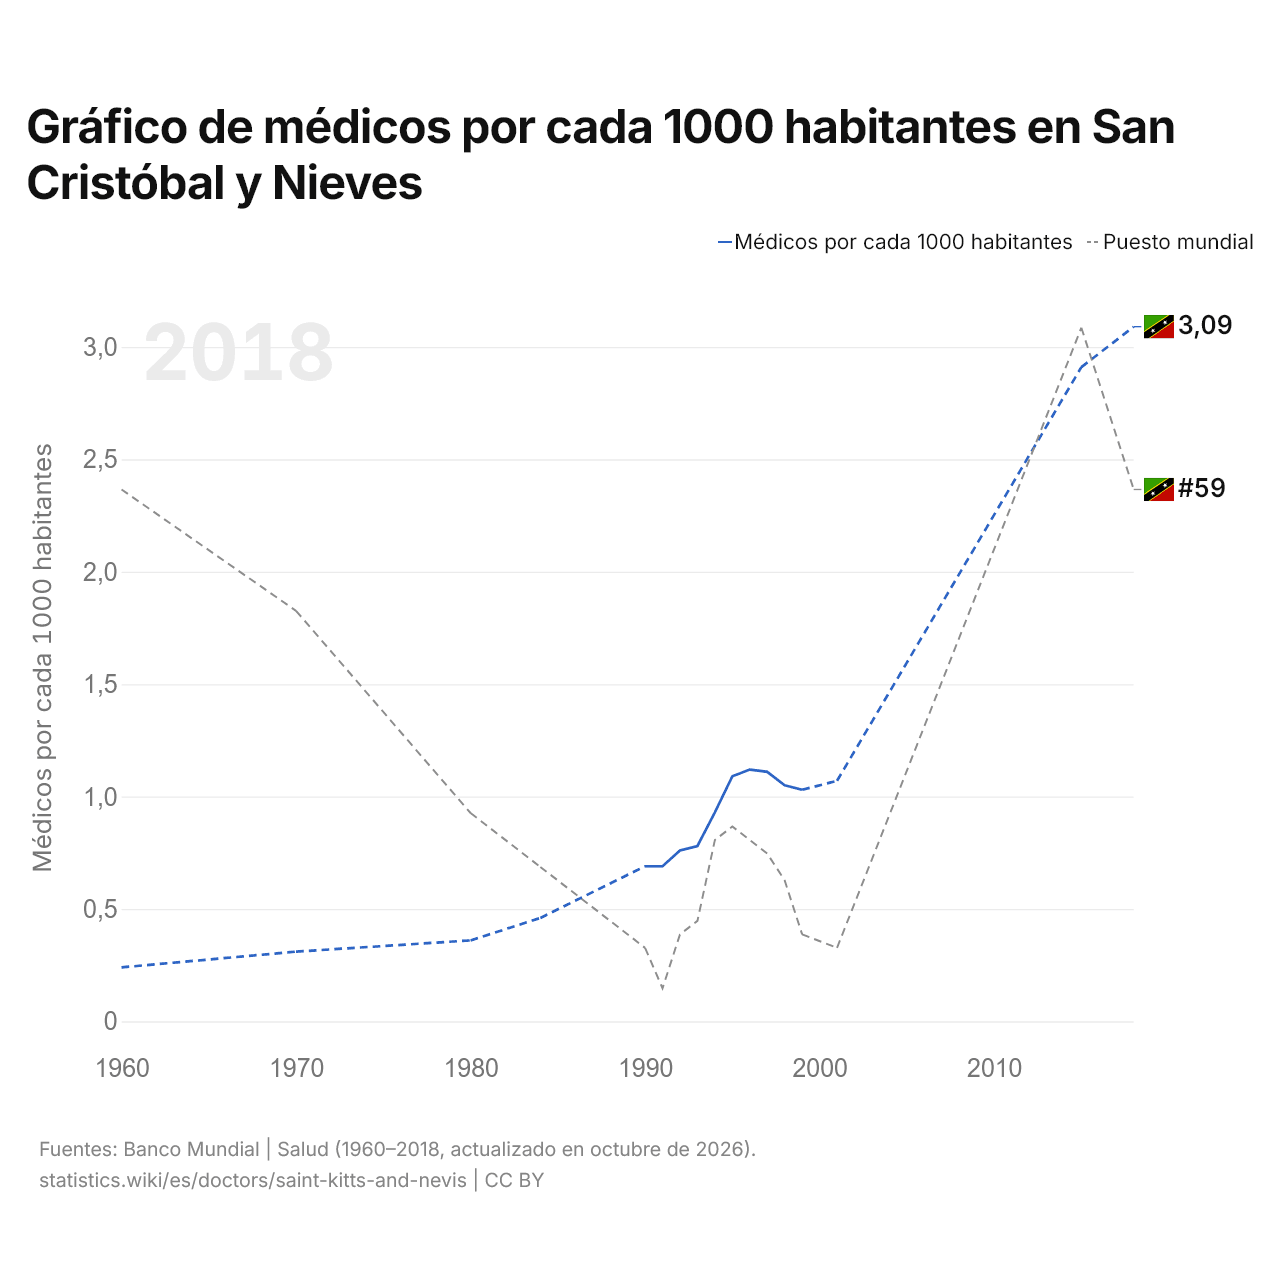
Gráfico de médicos por cada 1000 habitantes en San Cristóbal y Nieves
| Año | Médicos por cada 1000 habitantes | Puesto mundial |
|---|---|---|
| Médicos por cada 1000 habitantes | ||
| 2018 | 3,09 | #59 |
| 2017 | - | - |
| 2016 | - | - |
| 2015 | 2,91 | #47 |
| 2014 | - | - |
| 2013 | - | - |
| 2012 | - | - |
| 2011 | - | - |
| 2010 | - | - |
| 2009 | - | - |
| 2008 | - | - |
| 2007 | - | - |
| 2006 | - | - |
| 2005 | - | - |
| 2004 | - | - |
| 2003 | - | - |
| 2002 | - | - |
| 2001 | 1,07 | #93 |
| 2000 | - | - |
| 1999 | 1,03 | #92 |
| 1998 | 1,05 | #88 |
| 1997 | 1,11 | #86 |
| 1996 | 1,12 | #85 |
| 1995 | 1,09 | #84 |
| 1994 | 0,93 | #85 |
| 1993 | 0,78 | #91 |
| 1992 | 0,76 | #92 |
| 1991 | 0,69 | #96 |
| 1990 | 0,69 | #93 |
| 1989 | - | - |
| 1988 | - | - |
| 1987 | - | - |
| 1986 | - | - |
| 1985 | - | - |
| 1984 | 0,46 | #87 |
| 1983 | - | - |
| 1982 | - | - |
| 1981 | - | - |
| 1980 | 0,36 | #83 |
| 1979 | - | - |
| 1978 | - | - |
| 1977 | - | - |
| 1976 | - | - |
| 1975 | - | - |
| 1974 | - | - |
| 1973 | - | - |
| 1972 | - | - |
| 1971 | - | - |
| 1970 | 0,31 | #68 |
| 1969 | - | - |
| 1968 | - | - |
| 1967 | - | - |
| 1966 | - | - |
| 1965 | - | - |
| 1964 | - | - |
| 1963 | - | - |
| 1962 | - | - |
| 1961 | - | - |
| 1960 | 0,24 | #59 |
Hay 3,09 médicos por cada 1000 habitantes (2018) en San Cristóbal y Nieves, frente a 0,24 en 1960. Ocupa el puesto 59 del mundo. Su mejor posición fue el puesto 47, por última vez en 2015.
El número de médicos por cada 1000 habitantes en San Cristóbal y Nieves es el 8.º más alto de 32 países de América Latina, donde va desde 0,29 en Haití hasta 9,54 en Cuba (2021).
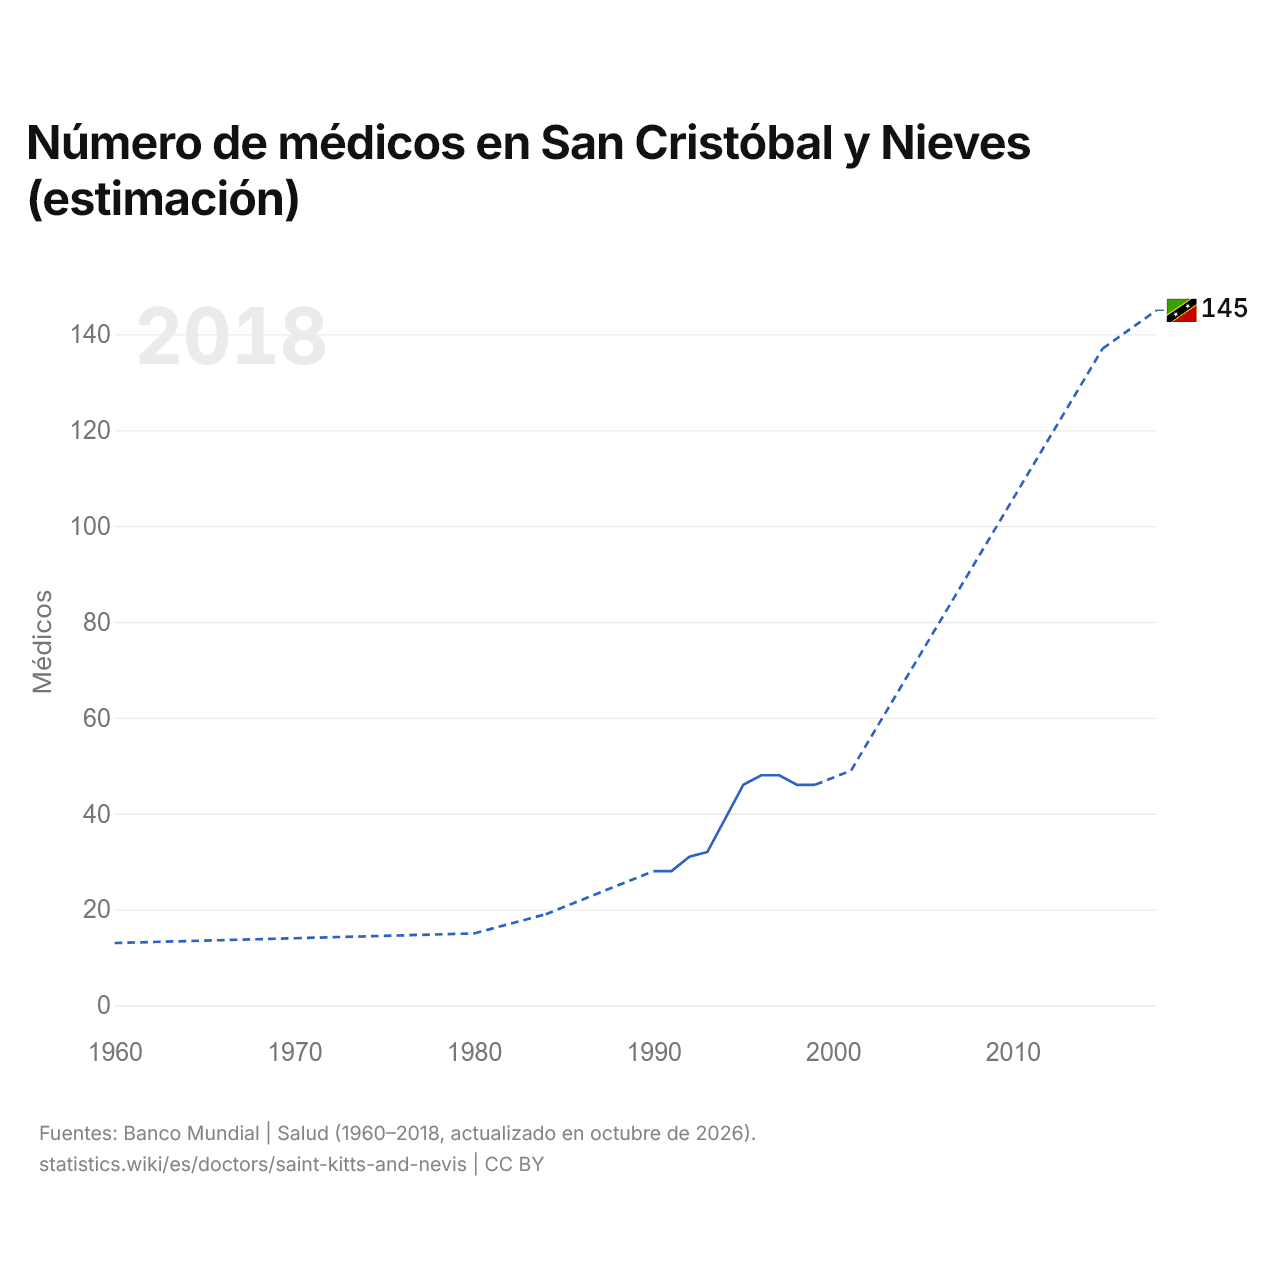
Número de médicos en San Cristóbal y Nieves (estimación)
| Año | Médicos |
|---|---|
| Médicos | |
| 2018 | 145 |
| 2017 | - |
| 2016 | - |
| 2015 | 137 |
| 2014 | - |
| 2013 | - |
| 2012 | - |
| 2011 | - |
| 2010 | - |
| 2009 | - |
| 2008 | - |
| 2007 | - |
| 2006 | - |
| 2005 | - |
| 2004 | - |
| 2003 | - |
| 2002 | - |
| 2001 | 49 |
| 2000 | - |
| 1999 | 46 |
| 1998 | 46 |
| 1997 | 48 |
| 1996 | 48 |
| 1995 | 46 |
| 1994 | 39 |
| 1993 | 32 |
| 1992 | 31 |
| 1991 | 28 |
| 1990 | 28 |
| 1989 | - |
| 1988 | - |
| 1987 | - |
| 1986 | - |
| 1985 | - |
| 1984 | 19 |
| 1983 | - |
| 1982 | - |
| 1981 | - |
| 1980 | 15 |
| 1979 | - |
| 1978 | - |
| 1977 | - |
| 1976 | - |
| 1975 | - |
| 1974 | - |
| 1973 | - |
| 1972 | - |
| 1971 | - |
| 1970 | 14 |
| 1969 | - |
| 1968 | - |
| 1967 | - |
| 1966 | - |
| 1965 | - |
| 1964 | - |
| 1963 | - |
| 1962 | - |
| 1961 | - |
| 1960 | 13 |
Hay unos 145 médicos en San Cristóbal y Nieves, según las estimaciones (2018), frente a 13 médicos en 1960.
San Cristóbal y Nieves en la clasificación mundial de médicos por cada 1000 habitantes
| Puesto | País | Por cada 1000 habitantes | Número estimado | |
|---|---|---|---|---|
| 56 |
 Azerbaiyán |
3,19 (2022) | 32.300 | |
| 57 |
 China |
3,11 (2022) | 4.390.000 | |
| 58 |
 Serbia |
3,1 (2022) | 20.700 | |
| 59 |
 San Cristóbal |
3,09 | 145 | |
| 60 |
 Catar |
3,02 (2023) | 8030 | |
| 61 |
 EAU |
2,99 (2023) | 31.400 | |
| 62 |
 Luxemburgo |
2,98 (2017) | 1780 |
Comparar los médicos por habitante de San Cristóbal y Nieves con los de otros países
Fuentes:
- Banco Mundial | Salud (1960–2023, actualizado en octubre de 2026)
Creative Commons Atribución (CC BY): puedes copiar, compartir, adaptar y reutilizar este contenido, también con fines comerciales, siempre que cites a statistics.wiki e indiques los cambios que hayas hecho. Las fuentes indicadas arriba pueden tener sus propias condiciones de licencia.