
Gráfico de médicos por cada 1000 habitantes en Portugal
| Año | Médicos por cada 1000 habitantes | Puesto mundial |
|---|---|---|
| Médicos por cada 1000 habitantes | ||
| 2022 | 5,85 | #5 |
| 2021 | 5,71 | #5 |
| 2020 | 5,58 | #5 |
| 2019 | 5,42 | #7 |
| 2018 | 5,28 | #7 |
| 2017 | 5,1 | #8 |
| 2016 | 4,93 | #9 |
| 2015 | 4,75 | #8 |
| 2014 | 4,56 | #8 |
| 2013 | 4,4 | #8 |
| 2012 | 4,24 | #8 |
| 2011 | 4,12 | #9 |
| 2010 | 3,98 | #10 |
| 2009 | 3,86 | #9 |
| 2008 | 3,75 | #11 |
| 2007 | 3,66 | #15 |
| 2006 | 3,57 | #18 |
| 2005 | 3,5 | #19 |
| 2004 | 3,42 | #18 |
| 2003 | 3,34 | #20 |
| 2002 | 3,29 | #19 |
| 2001 | 3,26 | #19 |
| 2000 | 3,21 | #20 |
| 1999 | 3,13 | #24 |
| 1998 | 3,11 | #23 |
| 1997 | 3,05 | #26 |
| 1996 | 3,01 | #26 |
| 1995 | 2,93 | #30 |
| 1994 | 2,9 | #31 |
| 1993 | 2,88 | #31 |
| 1992 | 2,86 | #29 |
| 1991 | 2,84 | #29 |
| 1990 | 2,81 | #28 |
| 1989 | - | - |
| 1988 | - | - |
| 1987 | - | - |
| 1986 | - | - |
| 1985 | - | - |
| 1984 | - | - |
| 1983 | - | - |
| 1982 | - | - |
| 1981 | - | - |
| 1980 | - | - |
| 1979 | 1,9 | #12 |
| 1978 | 1,7 | #17 |
| 1977 | 1,5 | #19 |
| 1976 | 1,3 | #22 |
| 1975 | 1,2 | #24 |
| 1974 | 1,2 | #21 |
| 1973 | 1,1 | #25 |
| 1972 | 1 | #28 |
| 1971 | 1 | #28 |
| 1970 | 0,9 | #30 |
| 1969 | 0,9 | #25 |
| 1968 | 1 | #23 |
| 1967 | 0,9 | #26 |
| 1966 | 0,9 | #26 |
| 1965 | 0,9 | #26 |
| 1964 | 0,8 | #27 |
| 1963 | 0,8 | #27 |
| 1962 | 0,9 | #24 |
| 1961 | 0,8 | #27 |
| 1960 | 0,8 | #23 |
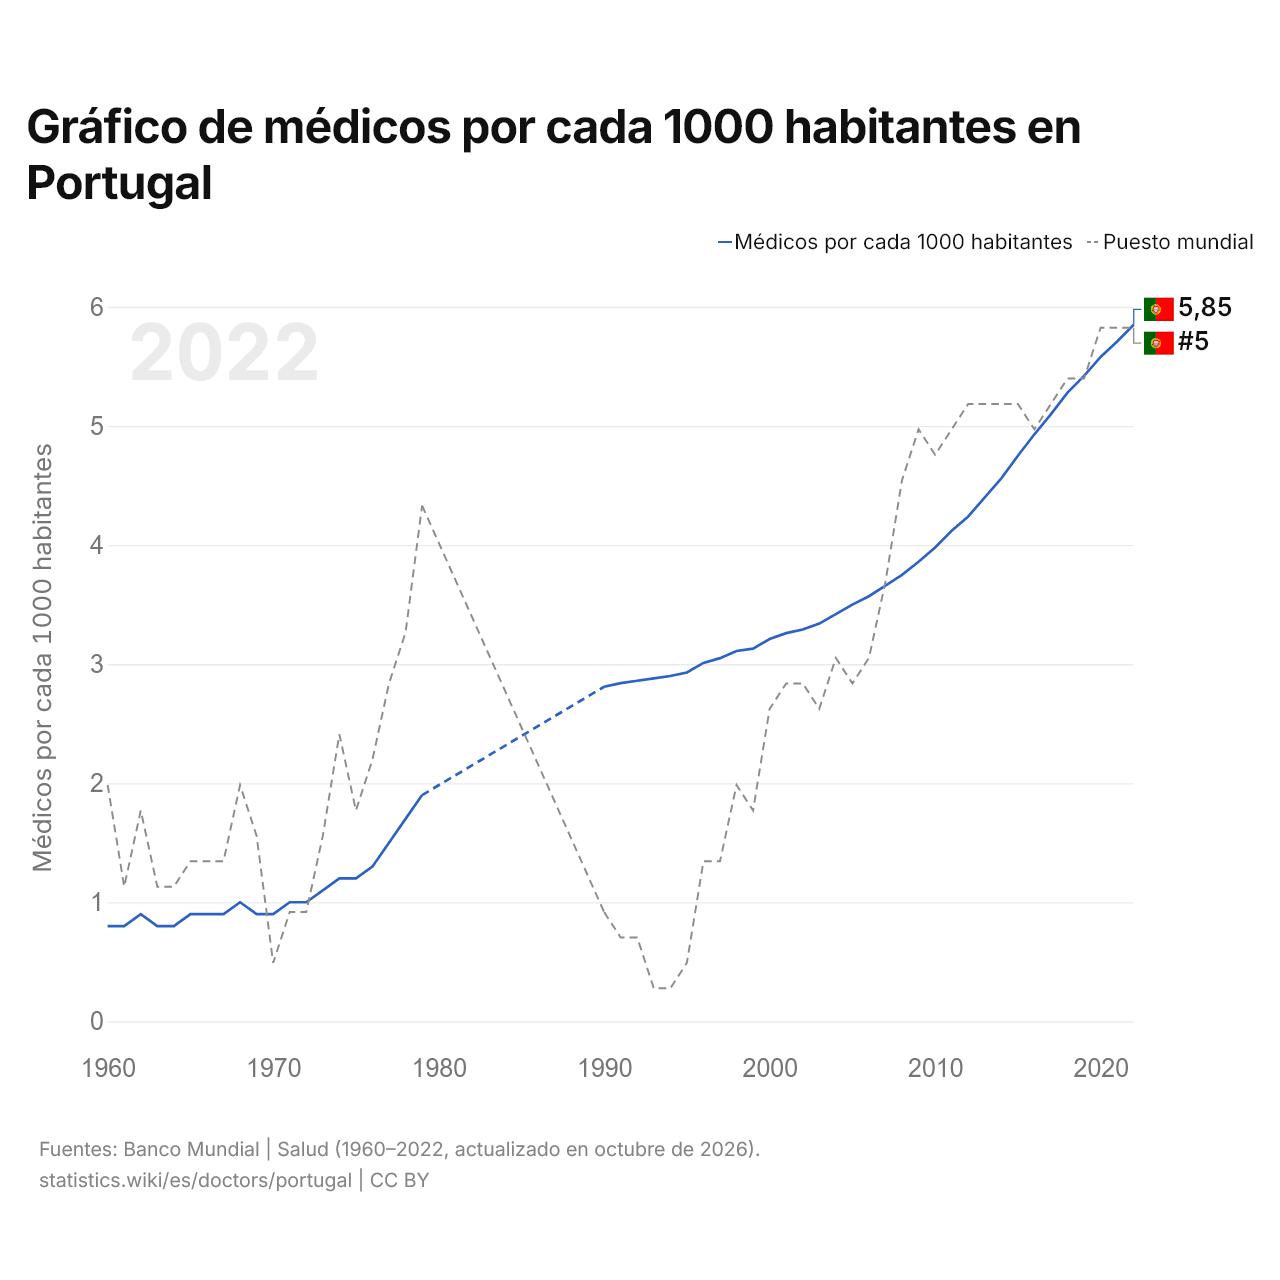
Hay 5,85 médicos por cada 1000 habitantes en Portugal, frente a 0,8 en 1960. Ocupa el puesto 5 del mundo, que mantiene desde 2020.
El número de médicos por cada 1000 habitantes en Portugal es el 3.º más alto de 43 países de Europa, donde va desde 1,88 en Albania (2020) hasta 8,61 en Mónaco (2020).
Número de médicos en Portugal (estimación)
| Año | Médicos |
|---|---|
| Médicos | |
| 2022 | 61.100 |
| 2021 | 59.200 |
| 2020 | 57.400 |
| 2019 | 55.800 |
| 2018 | 54.300 |
| 2017 | 52.600 |
| 2016 | 50.900 |
| 2015 | 49.200 |
| 2014 | 47.400 |
| 2013 | 46.000 |
| 2012 | 44.600 |
| 2011 | 43.500 |
| 2010 | 42.100 |
| 2009 | 40.800 |
| 2008 | 39.600 |
| 2007 | 38.600 |
| 2006 | 37.600 |
| 2005 | 36.800 |
| 2004 | 35.800 |
| 2003 | 35.000 |
| 2002 | 34.300 |
| 2001 | 33.800 |
| 2000 | 33.000 |
| 1999 | 32.000 |
| 1998 | 31.600 |
| 1997 | 30.800 |
| 1996 | 30.300 |
| 1995 | 29.400 |
| 1994 | 28.900 |
| 1993 | 28.700 |
| 1992 | 28.500 |
| 1991 | 28.300 |
| 1990 | 28.000 |
| 1989 | - |
| 1988 | - |
| 1987 | - |
| 1986 | - |
| 1985 | - |
| 1984 | - |
| 1983 | - |
| 1982 | - |
| 1981 | - |
| 1980 | - |
| 1979 | 18.400 |
| 1978 | 16.200 |
| 1977 | 14.200 |
| 1976 | 12.200 |
| 1975 | 10.900 |
| 1974 | 10.500 |
| 1973 | 9.500 |
| 1972 | 8.630 |
| 1971 | 8.640 |
| 1970 | 7.810 |
| 1969 | 7.880 |
| 1968 | 8.840 |
| 1967 | 7.990 |
| 1966 | 8.040 |
| 1965 | 8.100 |
| 1964 | 7.230 |
| 1963 | 7.220 |
| 1962 | 8.090 |
| 1961 | 7.140 |
| 1960 | 7.090 |
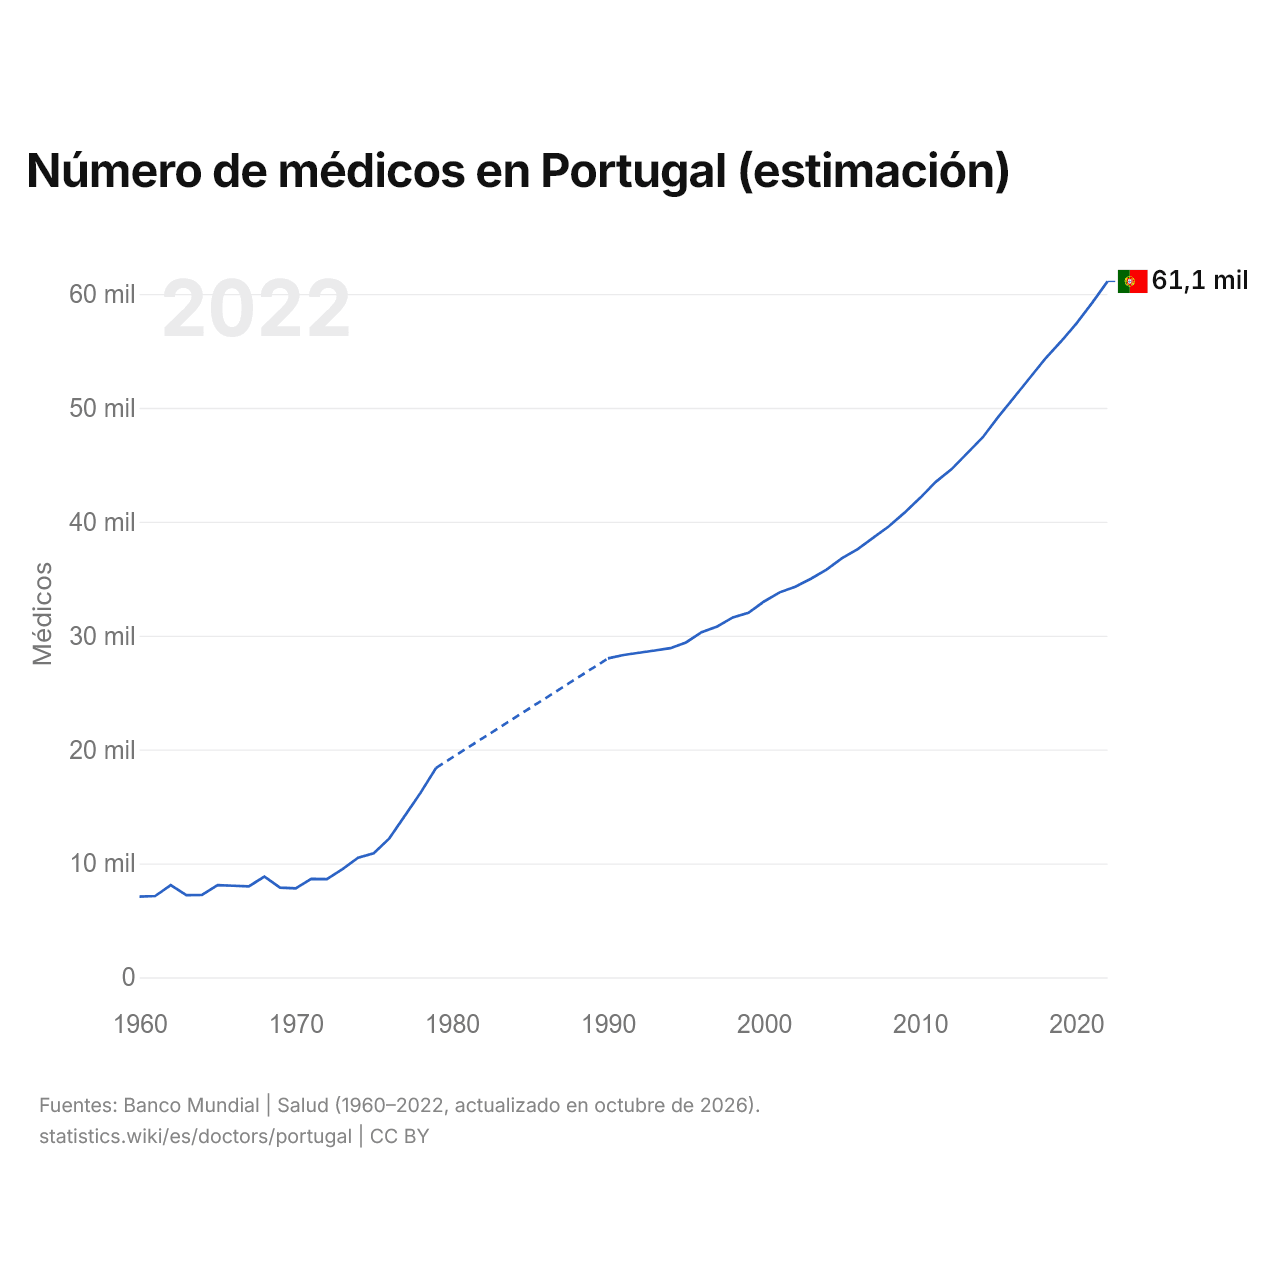
Hay unos 61.100 médicos en Portugal, según las estimaciones, frente a 7090 médicos en 1960.
Portugal en la clasificación mundial de médicos por cada 1000 habitantes







Comparar los médicos por habitante de Portugal con los de otros países
Fuentes:
- Banco Mundial | Salud (1960–2023, actualizado en octubre de 2026)
Creative Commons Atribución (CC BY): puedes copiar, compartir, adaptar y reutilizar este contenido, también con fines comerciales, siempre que cites a statistics.wiki e indiques los cambios que hayas hecho. Las fuentes indicadas arriba pueden tener sus propias condiciones de licencia.