
Liberia vs Guinea: exportaciones de armas, municiones y explosivos (US$), 2001–2025
1x
| Año | US$ | |
|---|---|---|
 Liberia |
 Guinea |
|
| 2025 | 151.000 US$ | - |
| 2024 | 0 US$ | - |
| 2023 | 3.000 US$ | - |
| 2022 | 0 US$ | - |
| 2021 | 0 US$ | - |
| 2020 | 0 US$ | - |
| 2019 | 0 US$ | - |
| 2018 | 5.133.000 US$ | - |
| 2017 | 3.029.000 US$ | - |
| 2016 | - | 249.000 US$ |
| 2015 | - | 1.269.000 US$ |
| 2014 | - | 642.000 US$ |
| 2013 | - | 1.073.000 US$ |
| 2012 | - | 1.749.000 US$ |
| 2011 | - | 896.000 US$ |
| 2010 | - | 636.000 US$ |
| 2009 | - | 413.000 US$ |
| 2008 | - | 484.000 US$ |
| 2007 | - | 59.000 US$ |
| 2006 | - | 0 US$ |
| 2005 | - | 0 US$ |
| 2004 | - | 0 US$ |
| 2003 | - | 0 US$ |
| 2002 | - | 0 US$ |
| 2001 | - | 76.000 US$ |
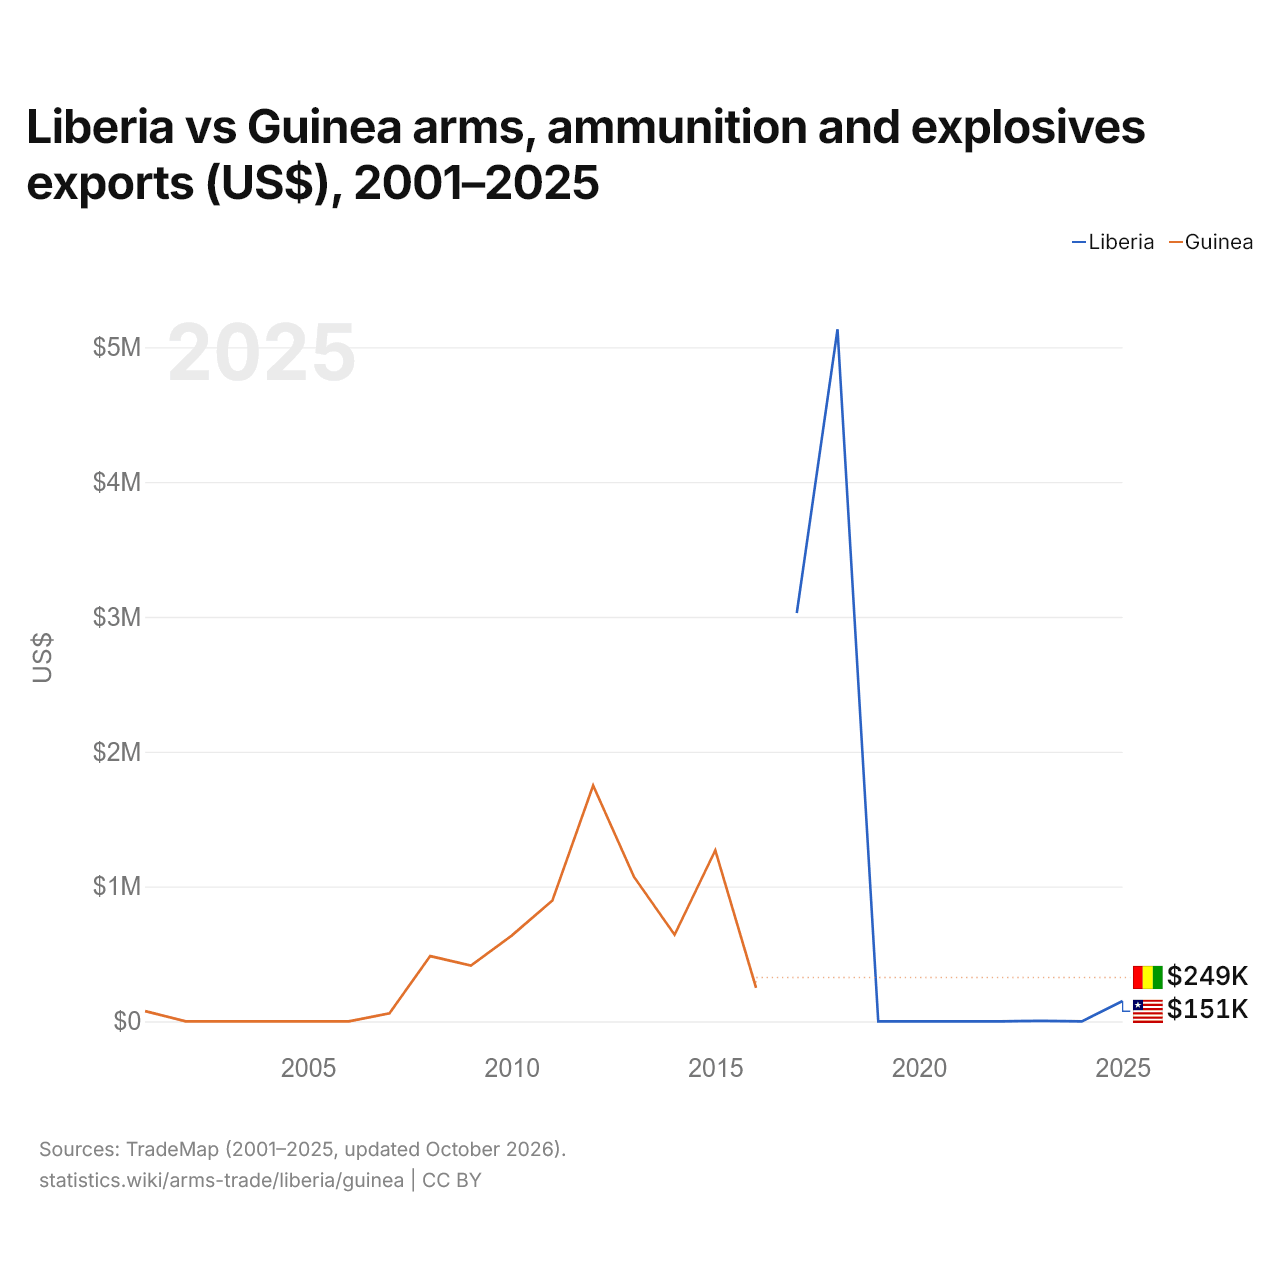
Las exportaciones de armas y municiones de Liberia son de 151.000 US$ (2025), y las de Guinea, de 249.000 US$ (2016).
Liberia vs Guinea: importaciones de armas, municiones y explosivos (US$), 2001–2025
1x
| Año | US$ | |
|---|---|---|
|
Liberia
|
Guinea
|
|
| 2025 | 12.554.000 US$ | - |
| 2024 | 2.338.000 US$ | - |
| 2023 | 1.913.000 US$ | - |
| 2022 | 652.000 US$ | - |
| 2021 | 3.196.000 US$ | - |
| 2020 | 3.109.000 US$ | - |
| 2019 | 2.389.000 US$ | - |
| 2018 | 2.045.000 US$ | - |
| 2017 | 3.626.000 US$ | - |
| 2016 | - | 8.014.000 US$ |
| 2015 | - | 7.448.000 US$ |
| 2014 | - | 6.652.000 US$ |
| 2013 | - | 6.229.000 US$ |
| 2012 | - | 2.118.000 US$ |
| 2011 | - | 1.654.000 US$ |
| 2010 | - | 1.658.000 US$ |
| 2009 | - | 1.545.000 US$ |
| 2008 | - | 2.859.000 US$ |
| 2007 | - | 3.902.000 US$ |
| 2006 | - | 2.770.000 US$ |
| 2005 | - | 2.692.000 US$ |
| 2004 | - | 3.183.000 US$ |
| 2003 | - | 3.088.000 US$ |
| 2002 | - | 3.088.000 US$ |
| 2001 | - | 2.878.000 US$ |
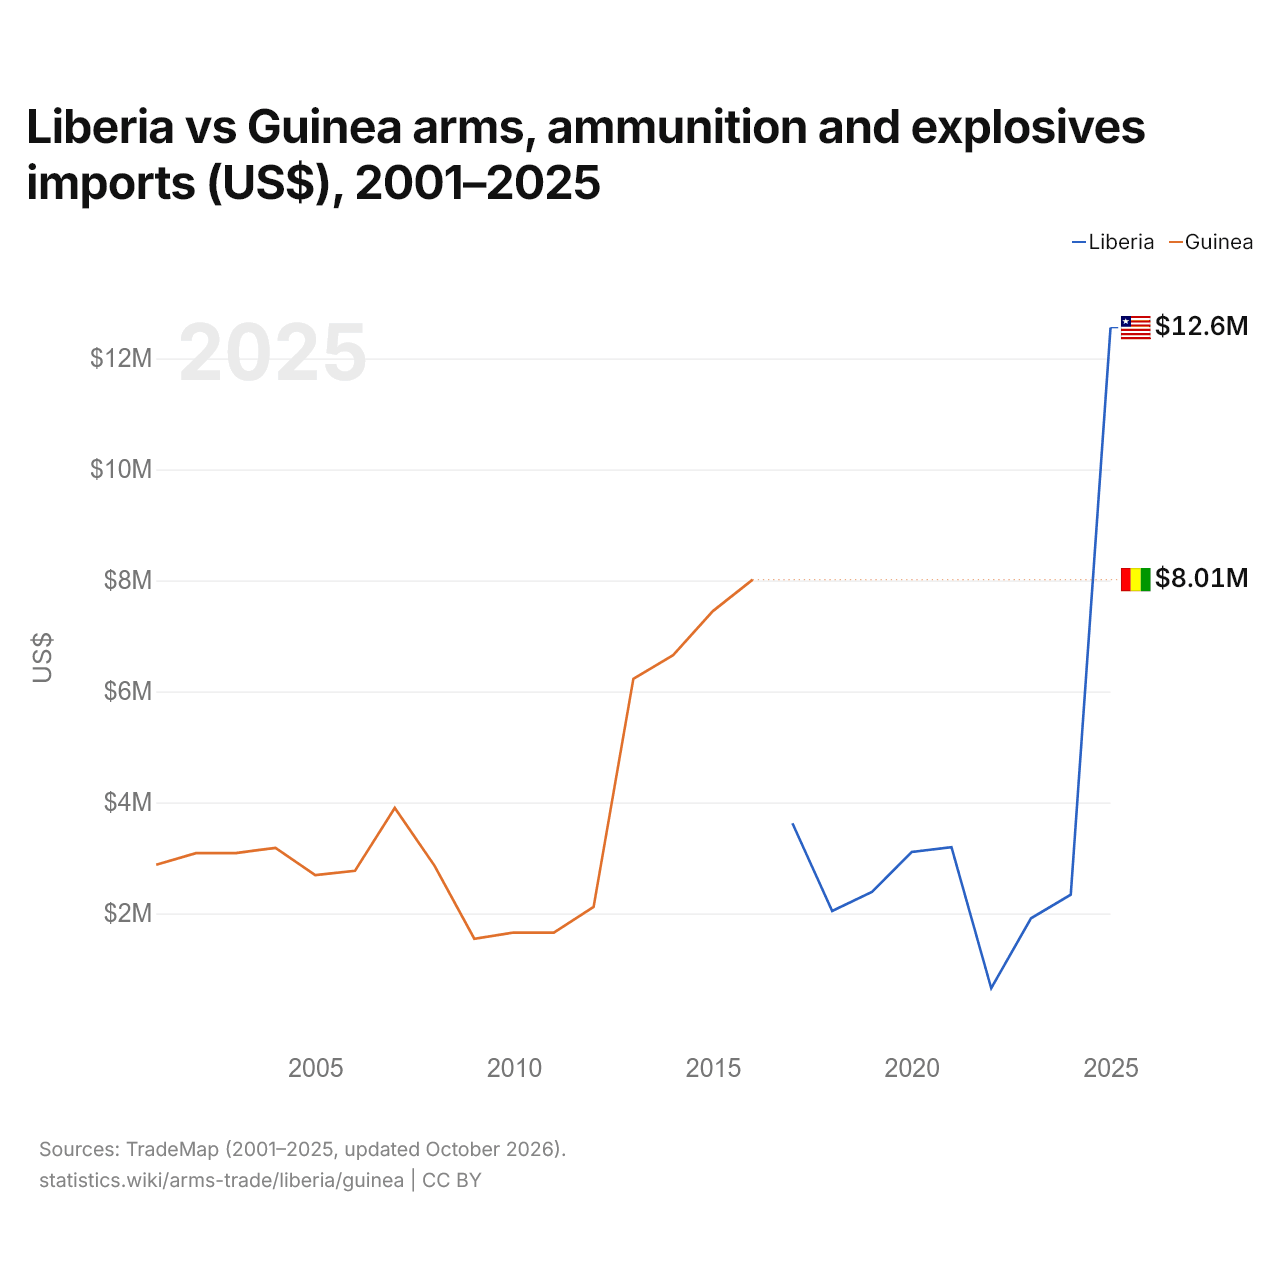
Las importaciones de armas y municiones de Liberia son de 12,6 millones de US$ (2025), y las de Guinea, de 8,01 millones de US$ (2016).
Liberia vs Guinea: datos del comercio de armas y municiones
|
Liberia
|
Guinea
|
|
|---|---|---|
| Exportaciones | 151 mil US$ (2025) | 249 mil US$ (2016) |
| Importaciones | 12,6 M US$ (2025) | 8,01 M US$ (2016) |
| Porcentaje del mundo | <0,001 % | 0,001 % |
| Puesto mundial | 118/170 | n/d |
| Principal comprador | Sierra Leona (100 %, 2025) | Sierra Leona (59,8 %, 2016) |
| Principal proveedor | Turquía (71 %, 2025) | Francia (52,2 %, 2016) |
Comparar el comercio de armas y municiones de 2 países cualesquiera
Fuentes:
- TradeMap (2001–2025, actualizado en octubre de 2026)
Creative Commons Atribución (CC BY): puedes copiar, compartir, adaptar y reutilizar este contenido, también con fines comerciales, siempre que cites a statistics.wiki e indiques los cambios que hayas hecho. Las fuentes indicadas arriba pueden tener sus propias condiciones de licencia.