
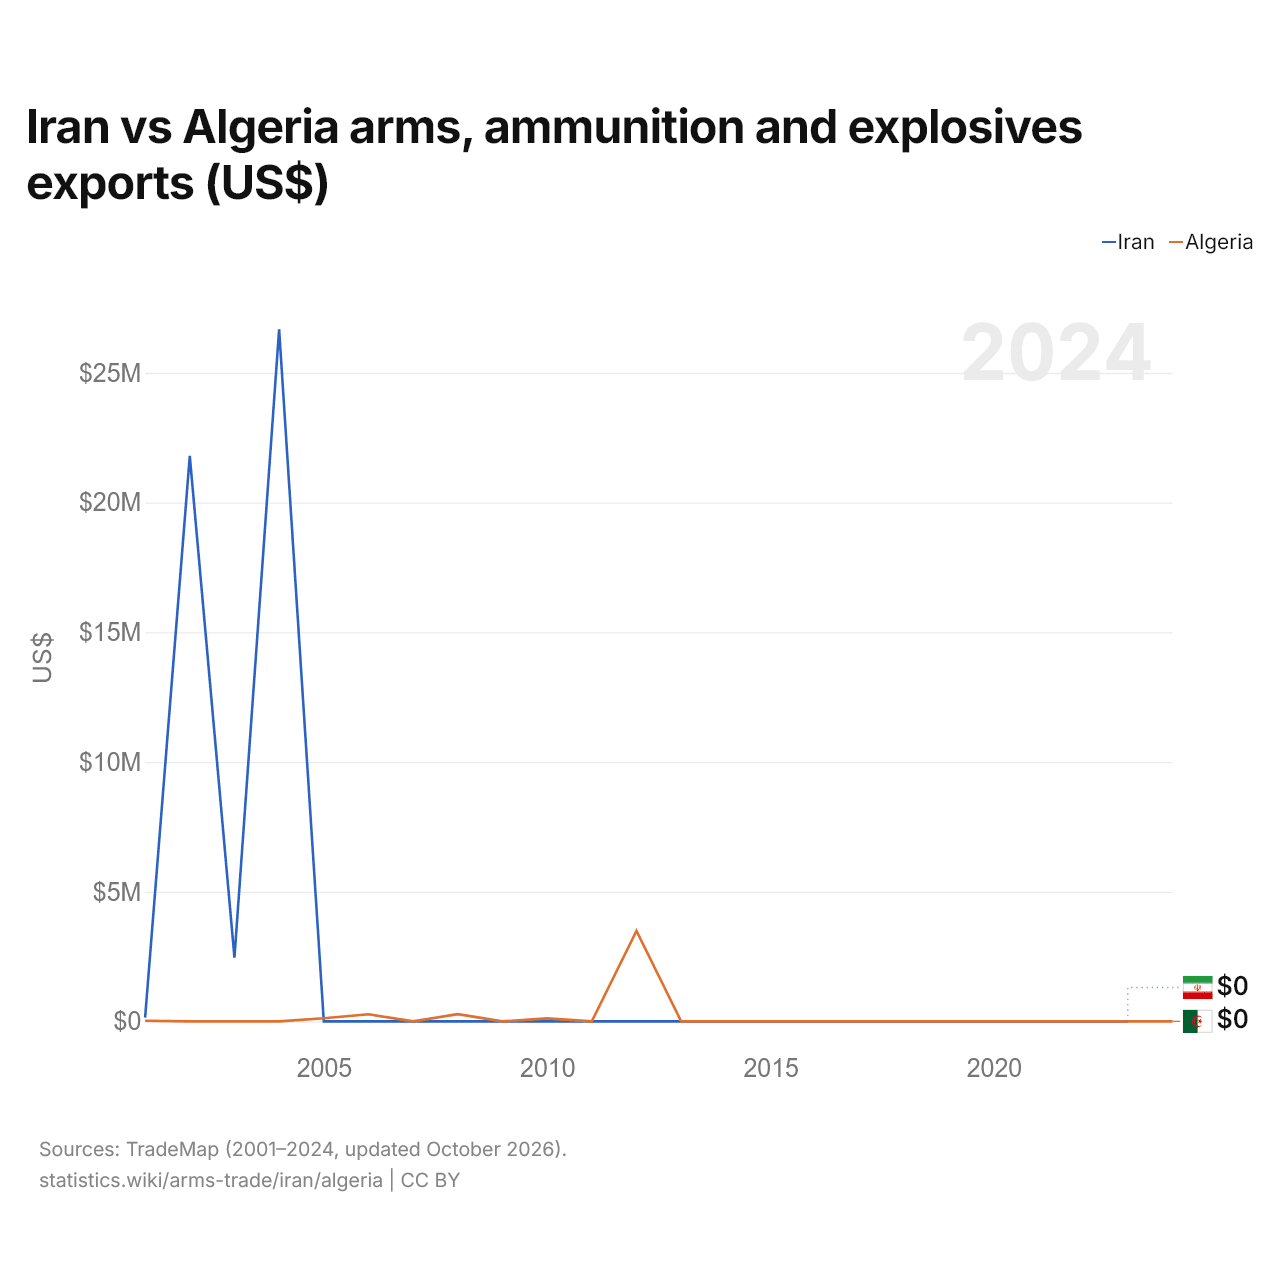
Irán vs Argelia: exportaciones de armas, municiones y explosivos (US$)
| Año | US$ | |
|---|---|---|
 Irán |
 Argelia |
|
| 2024 | - | 0 US$ |
| 2023 | 0 US$ | 0 US$ |
| 2022 | 0 US$ | 0 US$ |
| 2021 | 0 US$ | 0 US$ |
| 2020 | 0 US$ | 0 US$ |
| 2019 | 0 US$ | 0 US$ |
| 2018 | 0 US$ | 0 US$ |
| 2017 | 0 US$ | 0 US$ |
| 2016 | 0 US$ | 0 US$ |
| 2015 | 0 US$ | 0 US$ |
| 2014 | 0 US$ | 0 US$ |
| 2013 | 0 US$ | 0 US$ |
| 2012 | 0 US$ | 3.490.000 US$ |
| 2011 | 0 US$ | 0 US$ |
| 2010 | 0 US$ | 112.000 US$ |
| 2009 | 0 US$ | 0 US$ |
| 2008 | 0 US$ | 277.000 US$ |
| 2007 | 0 US$ | 0 US$ |
| 2006 | 0 US$ | 273.000 US$ |
| 2005 | 0 US$ | 118.000 US$ |
| 2004 | 26.678.000 US$ | 0 US$ |
| 2003 | 2.457.000 US$ | 0 US$ |
| 2002 | 21.794.000 US$ | 0 US$ |
| 2001 | 143.000 US$ | 23.000 US$ |
Las exportaciones de armas y municiones de Irán fueron de 0 US$ (2023) y las de Argelia, de 0 US$ (2023). En 2001, las de Irán fueron de 143.000 US$ y las de Argelia, de 23.000 US$; las de Irán, 6,2 veces mayores.
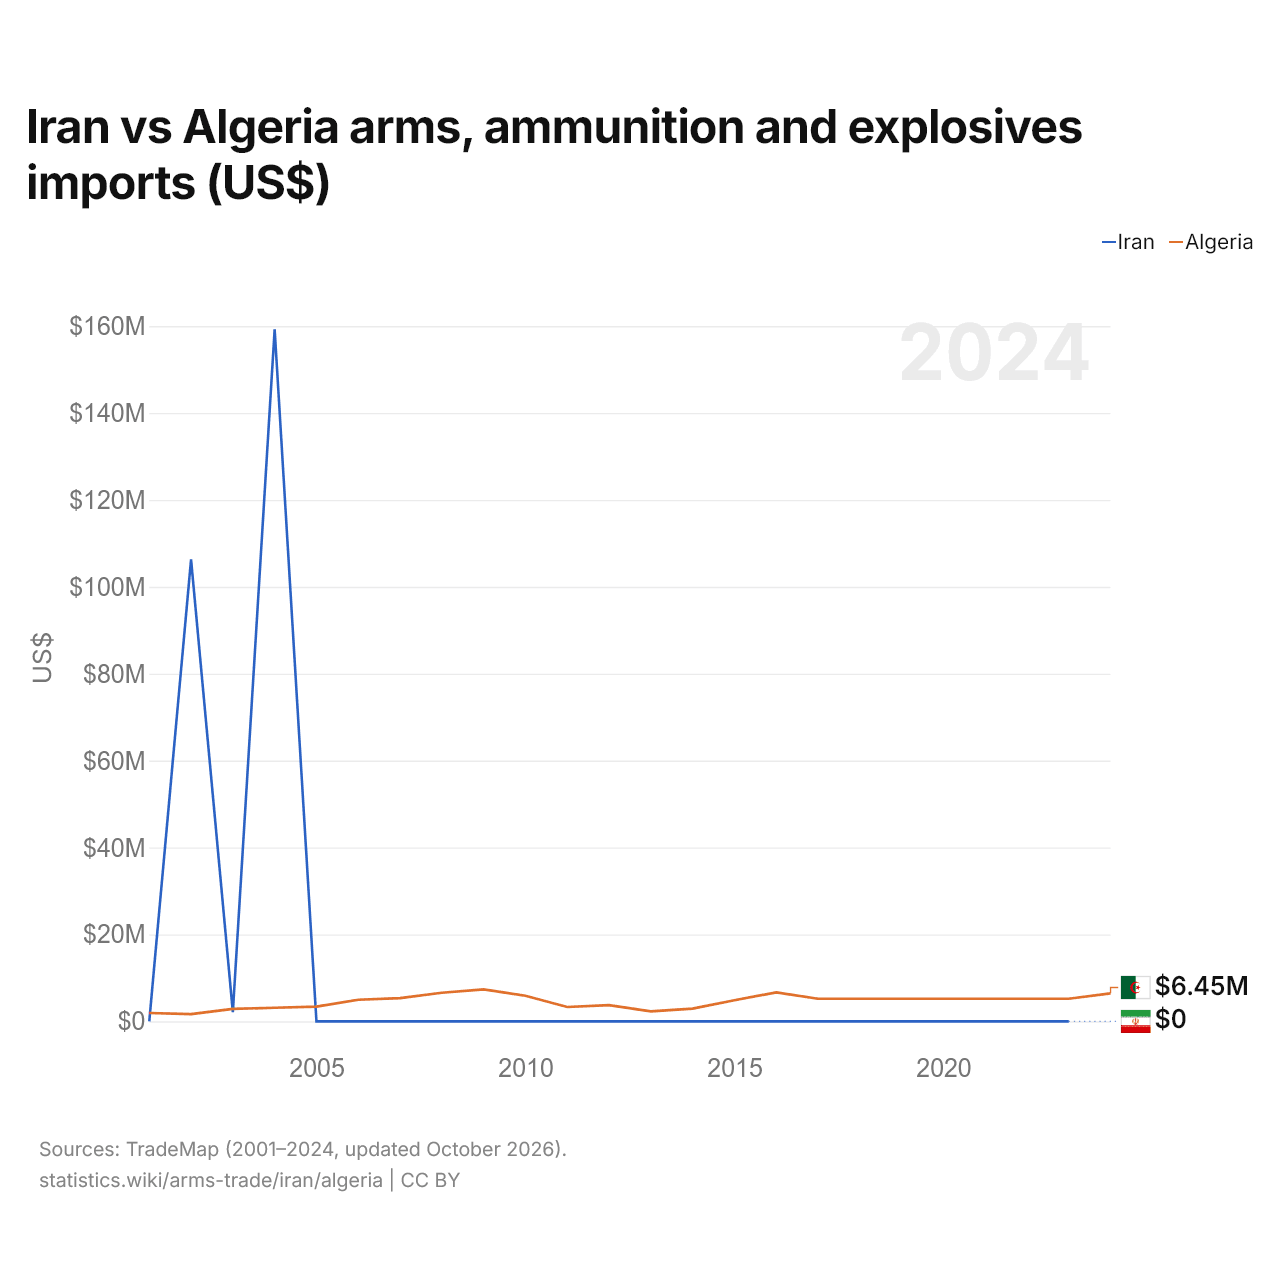
Irán vs Argelia: importaciones de armas, municiones y explosivos (US$)
| Año | US$ | |
|---|---|---|
|
Irán
|
Argelia
|
|
| 2024 | - | 6.447.000 US$ |
| 2023 | 0 US$ | 5.202.000 US$ |
| 2022 | 0 US$ | 5.202.000 US$ |
| 2021 | 0 US$ | 5.202.000 US$ |
| 2020 | 0 US$ | 5.202.000 US$ |
| 2019 | 0 US$ | 5.202.000 US$ |
| 2018 | 0 US$ | 5.202.000 US$ |
| 2017 | 0 US$ | 5.202.000 US$ |
| 2016 | 0 US$ | 6.664.000 US$ |
| 2015 | 0 US$ | 4.851.000 US$ |
| 2014 | 0 US$ | 2.929.000 US$ |
| 2013 | 0 US$ | 2.286.000 US$ |
| 2012 | 0 US$ | 3.715.000 US$ |
| 2011 | 0 US$ | 3.292.000 US$ |
| 2010 | 0 US$ | 5.878.000 US$ |
| 2009 | 0 US$ | 7.359.000 US$ |
| 2008 | 0 US$ | 6.569.000 US$ |
| 2007 | 0 US$ | 5.333.000 US$ |
| 2006 | 0 US$ | 4.970.000 US$ |
| 2005 | 0 US$ | 3.386.000 US$ |
| 2004 | 159.270.000 US$ | 3.125.000 US$ |
| 2003 | 2.116.000 US$ | 2.869.000 US$ |
| 2002 | 106.333.000 US$ | 1.671.000 US$ |
| 2001 | 0 US$ | 1.922.000 US$ |
Las importaciones de armas y municiones de Irán fueron de 0 US$ (2023) y las de Argelia, de 5,2 millones de US$ (2023). En 2001, las de Irán fueron de 0 US$ y las de Argelia, de 1,92 millones de US$.
Irán vs Argelia: datos del comercio de armas y municiones
|
Irán
|
Argelia
|
|
|---|---|---|
| Exportaciones | 0 US$ (2023) | 0 US$ (2024) |
| Importaciones | 0 US$ (2023) | 6,45 M US$ (2024) |
| Porcentaje del mundo | 0 % | 0 % |
| Puesto mundial | 141/170 | 141/170 |
| Principal comprador | Siria (27,3 %, 2004) | China (100 %, 2012) |
| Principal proveedor | China (61,8 %, 2004) | China (53,4 %, 2024) |
Comparar el comercio de armas y municiones de 2 países cualesquiera
Fuentes:
- TradeMap (2001–2024, actualizado en octubre de 2026)
Creative Commons Atribución (CC BY): puedes copiar, compartir, adaptar y reutilizar este contenido, también con fines comerciales, siempre que cites a statistics.wiki e indiques los cambios que hayas hecho. Las fuentes indicadas arriba pueden tener sus propias condiciones de licencia.