
Taiwán vs Perú: gráfico de la superficie de tierras agrícolas
1x
| Año | Tierras agrícolas, km² | |
|---|---|---|
| Taiwán | Perú | |
| 2024 | - | 242.986 |
| 2023 | 7.785 | 243.848 |
| 2022 | - | 243.856 |
| 2021 | - | 249.007 |
| 2020 | - | 243.820 |
| 2019 | - | 238.633 |
| 2018 | - | 240.946 |
| 2017 | - | 242.501 |
| 2016 | - | 240.000 |
| 2015 | 7.966 | 243.138 |
| 2014 | - | 242.289 |
| 2013 | - | 241.410 |
| 2012 | - | 240.540 |
| 2011 | 8.083 | 239.594 |
| 2010 | - | 238.647 |
| 2009 | - | 237.700 |
| 2008 | - | 236.753 |
| 2007 | - | 235.806 |
| 2006 | - | 234.860 |
| 2005 | - | 233.913 |
| 2004 | - | 232.966 |
| 2003 | - | 232.019 |
| 2002 | - | 231.072 |
| 2001 | - | 230.126 |
| 2000 | - | 229.179 |
| 1999 | - | 228.232 |
| 1998 | - | 227.285 |
| 1997 | - | 226.338 |
| 1996 | - | 225.392 |
| 1995 | - | 224.445 |
| 1994 | - | 223.498 |
| 1993 | - | 224.296 |
| 1992 | - | 225.095 |
| 1991 | - | 225.893 |
| 1990 | - | 226.691 |
| 1989 | - | 224.411 |
| 1988 | - | 222.131 |
| 1987 | - | 219.851 |
| 1986 | - | 217.571 |
| 1985 | - | 215.291 |
| 1984 | - | 213.011 |
| 1983 | - | 210.731 |
| 1982 | - | 208.451 |
| 1981 | - | 206.171 |
| 1980 | - | 203.891 |
| 1979 | - | 201.610 |
| 1978 | - | 199.330 |
| 1977 | - | 197.050 |
| 1976 | - | 194.770 |
| 1975 | - | 192.490 |
| 1974 | - | 190.210 |
| 1973 | - | 187.930 |
| 1972 | - | 185.650 |
| 1971 | - | 179.510 |
| 1970 | - | 179.420 |
| 1969 | - | 178.480 |
| 1968 | - | 178.090 |
| 1967 | - | 177.630 |
| 1966 | - | 177.540 |
| 1965 | - | 178.290 |
| 1964 | - | 177.470 |
| 1963 | - | 177.280 |
| 1962 | - | 172.280 |
| 1961 | - | 170.850 |
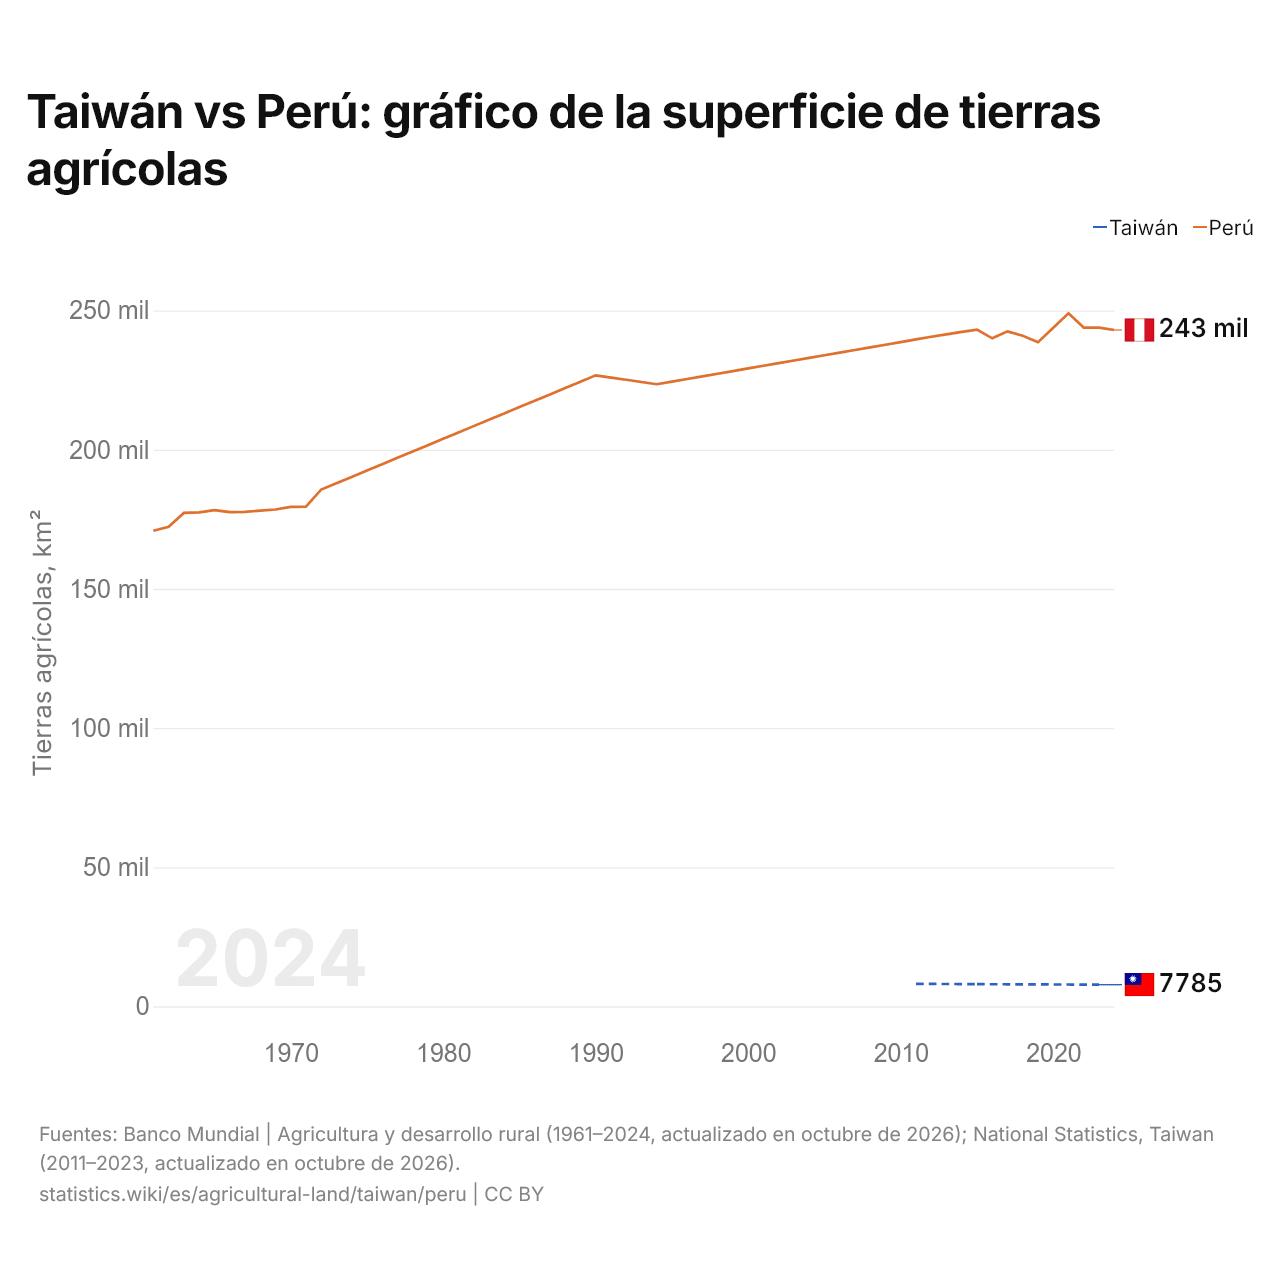
Las tierras agrícolas ocupaban 7785 km² (3006 mi²) en Taiwán y 243.848 km² (94.150 mi²) en Perú: la superficie agrícola de Perú era 31 veces la de Taiwán. En 2011, ocupaban 8083 km² (3121 mi²) en Taiwán y 239.594 km² (92.508 mi²) en Perú; la superficie agrícola de Perú era entonces 30 veces la de Taiwán.
Taiwán vs Perú: tierras agrícolas, superficie y % de la superficie terrestre
 Taiwán |
 Perú |
|
|---|---|---|
| Tierras agrícolas | 7785 km² | 242.986 km² (2024) |
| Tierras agrícolas, % | 21,5 % | 19,0 % (2024) |
| Tierras cultivables | n/d | 39.169 km² (2024) |
| Tierras cultivables, % | n/d | 3,1 % (2024) |
| Cultivos permanentes | 2513 km² | 22.802 km² (2024) |
| Cultivos permanentes, % | 6,9 % | 1,8 % (2024) |
| Prados y pastos | n/d | 181.015 km² (2024) |
| Prados y pastos, % | n/d | 14,1 % (2024) |
| Tierras cultivables por persona | n/d | 0,11 ha por persona (2024) |
| Puesto mundial por tierras agrícolas | 143.º de 194 | 46.º de 194 |
| Puesto mundial por tierras cultivables | n/d | 61.º de 191 |
| Puesto mundial por tierras cultivables por persona | n/d | 99.º de 191 |
Comparar las tierras agrícolas de 2 países cualesquiera
Fuentes:
- Banco Mundial | Agricultura y desarrollo rural (1961–2024, actualizado en octubre de 2026)
- National Statistics, Taiwan (2011–2023, actualizado en octubre de 2026)
Creative Commons Atribución (CC BY): puedes copiar, compartir, adaptar y reutilizar este contenido, también con fines comerciales, siempre que cites a statistics.wiki e indiques los cambios que hayas hecho. Las fuentes indicadas arriba pueden tener sus propias condiciones de licencia.