
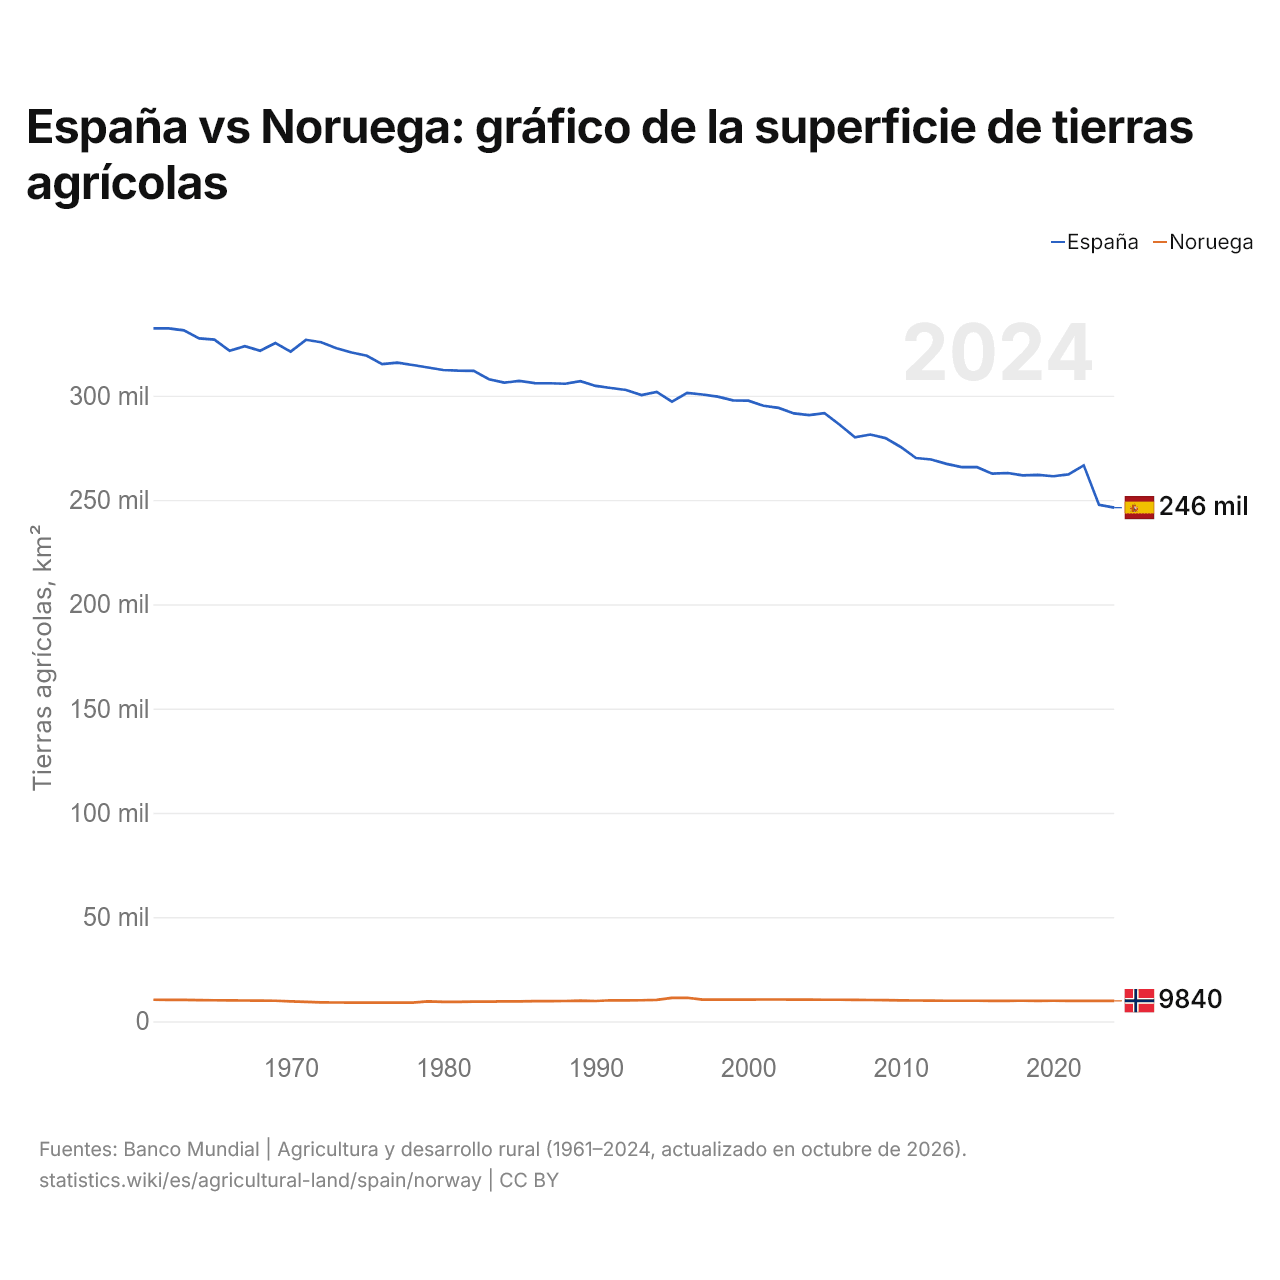
España vs Noruega: gráfico de la superficie de tierras agrícolas
| Año | Tierras agrícolas, km² | |
|---|---|---|
| España | Noruega | |
| 2024 | 246.335 | 9.840 |
| 2023 | 247.727 | 9.820 |
| 2022 | 266.634 | 9.850 |
| 2021 | 262.284 | 9.850 |
| 2020 | 261.426 | 9.860 |
| 2019 | 262.067 | 9.843 |
| 2018 | 261.833 | 9.863 |
| 2017 | 262.955 | 9.851 |
| 2016 | 262.657 | 9.837 |
| 2015 | 265.765 | 9.860 |
| 2014 | 265.780 | 9.868 |
| 2013 | 267.332 | 9.871 |
| 2012 | 269.420 | 9.928 |
| 2011 | 270.140 | 9.990 |
| 2010 | 275.450 | 10.059 |
| 2009 | 279.700 | 10.143 |
| 2008 | 281.420 | 10.248 |
| 2007 | 280.040 | 10.320 |
| 2006 | 286.130 | 10.350 |
| 2005 | 291.640 | 10.360 |
| 2004 | 290.710 | 10.400 |
| 2003 | 291.530 | 10.400 |
| 2002 | 294.190 | 10.460 |
| 2001 | 295.200 | 10.470 |
| 2000 | 297.660 | 10.420 |
| 1999 | 297.780 | 10.380 |
| 1998 | 299.580 | 10.470 |
| 1997 | 300.590 | 10.380 |
| 1996 | 301.390 | 11.320 |
| 1995 | 297.190 | 11.270 |
| 1994 | 301.830 | 10.300 |
| 1993 | 300.330 | 10.130 |
| 1992 | 302.790 | 10.030 |
| 1991 | 303.710 | 10.100 |
| 1990 | 304.720 | 9.760 |
| 1989 | 307.010 | 9.910 |
| 1988 | 305.780 | 9.760 |
| 1987 | 306.010 | 9.700 |
| 1986 | 306.100 | 9.690 |
| 1985 | 307.120 | 9.570 |
| 1984 | 306.280 | 9.540 |
| 1983 | 307.910 | 9.450 |
| 1982 | 311.910 | 9.420 |
| 1981 | 312.060 | 9.360 |
| 1980 | 312.380 | 9.360 |
| 1979 | 313.550 | 9.540 |
| 1978 | 314.780 | 9.000 |
| 1977 | 315.900 | 8.990 |
| 1976 | 315.160 | 8.960 |
| 1975 | 319.210 | 8.980 |
| 1974 | 320.780 | 9.010 |
| 1973 | 322.800 | 9.040 |
| 1972 | 325.680 | 9.100 |
| 1971 | 326.840 | 9.310 |
| 1970 | 321.190 | 9.540 |
| 1969 | 325.270 | 9.860 |
| 1968 | 321.590 | 9.940 |
| 1967 | 323.820 | 10.000 |
| 1966 | 321.560 | 10.050 |
| 1965 | 326.940 | 10.110 |
| 1964 | 327.530 | 10.190 |
| 1963 | 331.370 | 10.280 |
| 1962 | 332.320 | 10.310 |
| 1961 | 332.300 | 10.340 |
Las tierras agrícolas ocupan 246.335 km² (95.110 mi²) en España y 9840 km² (3799 mi²) en Noruega: la superficie agrícola de España es 25 veces la de Noruega. En 1961, ocupaban 332.300 km² (128.302 mi²) en España y 10.340 km² (3992 mi²) en Noruega; la superficie agrícola de España era entonces 32 veces la de Noruega.
Las tierras agrícolas ocupan el 49,3 % de la superficie terrestre de España y el 2,7 % de la de Noruega; las tierras cultivables, el 22,8 % y el 2,2 %.
España vs Noruega: tierras agrícolas, superficie y % de la superficie terrestre
 España |
 Noruega |
|
|---|---|---|
| Tierras agrícolas | 246.335 km² | 9840 km² |
| Tierras agrícolas, % | 49,3 % | 2,7 % |
| Tierras cultivables | 113.842 km² | 8050 km² |
| Tierras cultivables, % | 22,8 % | 2,2 % |
| Cultivos permanentes | 50.964 km² | 30 km² |
| Cultivos permanentes, % | 10,2 % | 0,0 % |
| Prados y pastos | 81.528 km² | 1760 km² |
| Prados y pastos, % | 16,3 % | 0,5 % |
| Tierras cultivables por persona | 0,23 ha por persona | 0,14 ha por persona |
| Puesto mundial por tierras agrícolas | 45.º de 194 | 140.º de 194 |
| Puesto mundial por tierras cultivables | 26.º de 191 | 115.º de 191 |
| Puesto mundial por tierras cultivables por persona | 47.º de 191 | 84.º de 191 |
Comparar las tierras agrícolas de 2 países cualesquiera
Fuentes:
- Banco Mundial | Agricultura y desarrollo rural (1961–2024, actualizado en octubre de 2026)
Creative Commons Atribución (CC BY): puedes copiar, compartir, adaptar y reutilizar este contenido, también con fines comerciales, siempre que cites a statistics.wiki e indiques los cambios que hayas hecho. Las fuentes indicadas arriba pueden tener sus propias condiciones de licencia.