
San Vicente y las Granadinas: tierras agrícolas, tierras cultivables y cultivos permanentes
| Año | Superficie, km² | ||
|---|---|---|---|
| Tierras agrícolas | Tierras cultivables | Cultivos permanentes | |
| 2024 | 70 | 20 | 30 |
| 2023 | 70 | 20 | 30 |
| 2022 | 70 | 20 | 30 |
| 2021 | 70 | 20 | 30 |
| 2020 | 70 | 20 | 30 |
| 2019 | 70 | 20 | 30 |
| 2018 | 70 | 20 | 30 |
| 2017 | 70 | 20 | 30 |
| 2016 | 70 | 20 | 30 |
| 2015 | 70 | 20 | 30 |
| 2014 | 70 | 20 | 30 |
| 2013 | 70 | 20 | 30 |
| 2012 | 70 | 20 | 30 |
| 2011 | 70 | 20 | 30 |
| 2010 | 70 | 20 | 30 |
| 2009 | 70 | 20 | 30 |
| 2008 | 70 | 20 | 30 |
| 2007 | 70 | 20 | 30 |
| 2006 | 70 | 20 | 30 |
| 2005 | 70 | 20 | 30 |
| 2004 | 70 | 20 | 30 |
| 2003 | 70 | 20 | 30 |
| 2002 | 70 | 20 | 30 |
| 2001 | 70 | 20 | 30 |
| 2000 | 70 | 20 | 30 |
| 1999 | 73,8 | 20,9 | 32,9 |
| 1998 | 77,7 | 22 | 35,7 |
| 1997 | 81,7 | 23,1 | 38,6 |
| 1996 | 85,6 | 24,2 | 41,4 |
| 1995 | 89,6 | 25,3 | 44,3 |
| 1994 | 93,5 | 26,4 | 47,1 |
| 1993 | 97,5 | 27,5 | 50 |
| 1992 | 101,5 | 28,6 | 52,9 |
| 1991 | 105,4 | 29,7 | 55,7 |
| 1990 | 109,4 | 30,8 | 58,6 |
| 1989 | 113,3 | 31,9 | 61,4 |
| 1988 | 117,3 | 33 | 64,3 |
| 1987 | 121,2 | 34,1 | 67,1 |
| 1986 | 130 | 40 | 70 |
| 1985 | 120 | 40 | 60 |
| 1984 | 120 | 40 | 60 |
| 1983 | 120 | 40 | 60 |
| 1982 | 110 | 40 | 50 |
| 1981 | 120 | 50 | 50 |
| 1980 | 120 | 50 | 50 |
| 1979 | 120 | 50 | 50 |
| 1978 | 110 | 50 | 40 |
| 1977 | 110 | 50 | 40 |
| 1976 | 100 | 50 | 40 |
| 1975 | 100 | 50 | 40 |
| 1974 | 100 | 50 | 40 |
| 1973 | 100 | 50 | 40 |
| 1972 | 110 | 60 | 40 |
| 1971 | 110 | 60 | 40 |
| 1970 | 110 | 60 | 40 |
| 1969 | 110 | 60 | 40 |
| 1968 | 110 | 60 | 40 |
| 1967 | 110 | 60 | 40 |
| 1966 | 110 | 60 | 40 |
| 1965 | 110 | 60 | 40 |
| 1964 | 110 | 60 | 40 |
| 1963 | 110 | 60 | 40 |
| 1962 | 100 | 60 | 30 |
| 1961 | 100 | 60 | 30 |
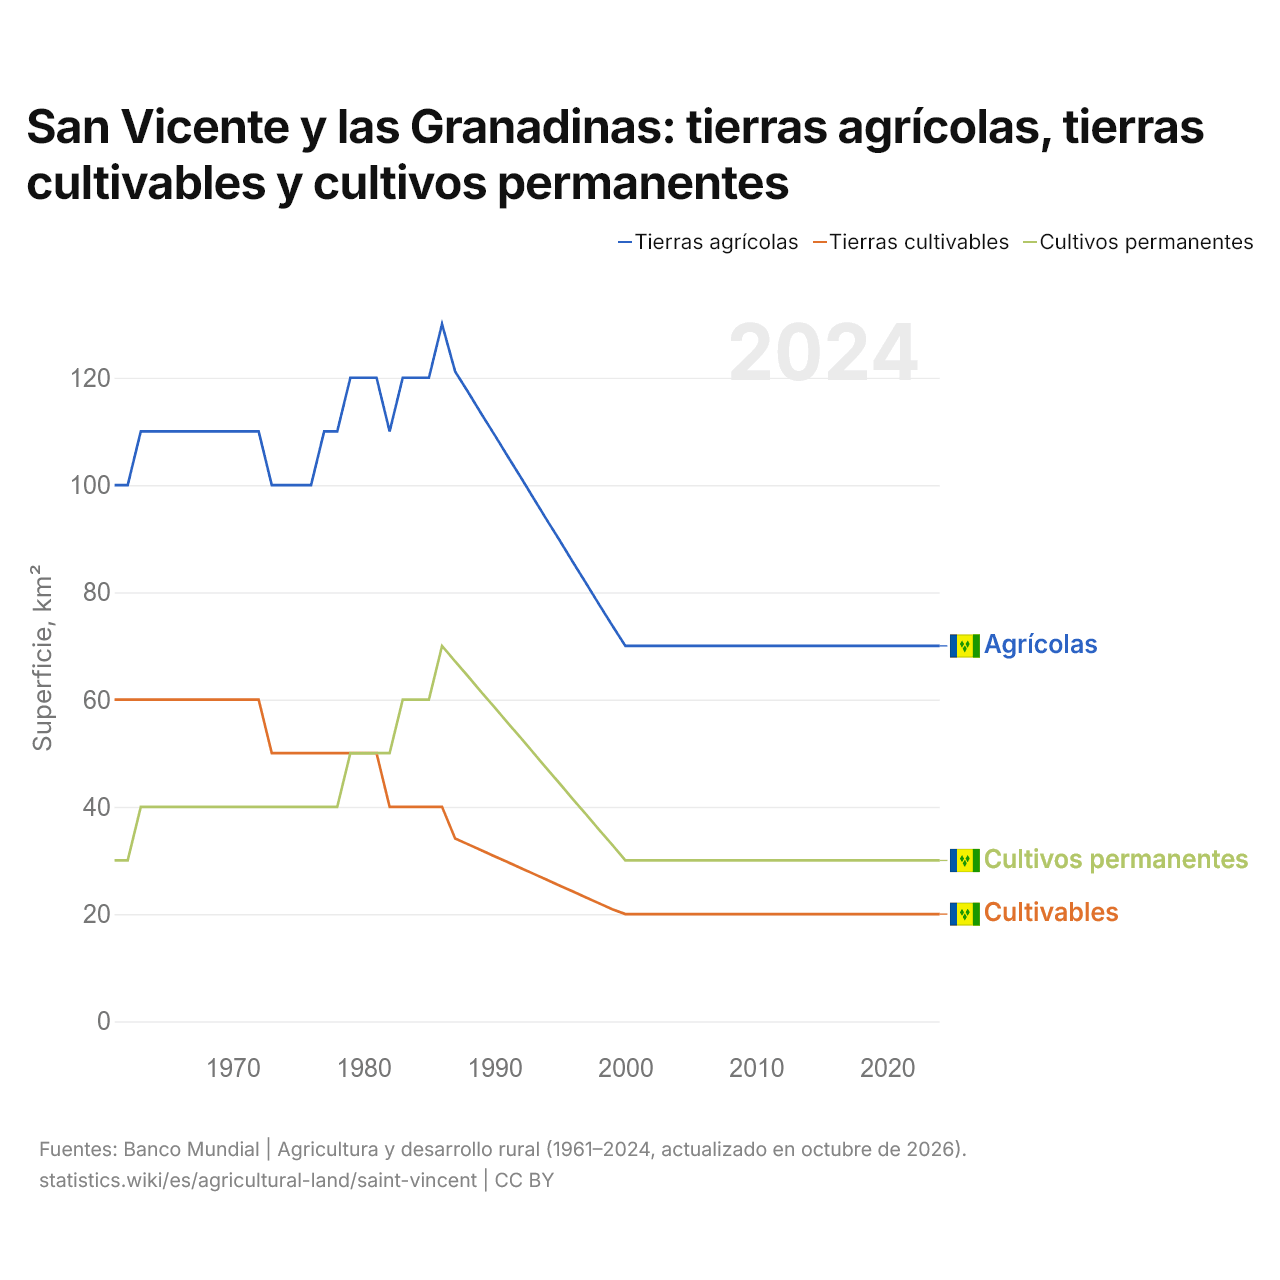
Las tierras agrícolas de San Vicente y las Granadinas ocupan 70 km² (27 mi²), menos que los 100 km² (38,6 mi²) de 1961. Su superficie agrícola fue máxima en 1986: 130 km² (50,2 mi²). Las tierras cultivables ocupan 20 km² (7,72 mi²), y los cultivos permanentes, 30 km² (11,6 mi²).
Las tierras agrícolas de San Vicente y las Granadinas ocupan el 32.º puesto entre 34 países de América Latina. La agricultura representó el 3,4 % del PIB de San Vicente y las Granadinas en 2025.
Tierras agrícolas de San Vicente y las Granadinas por uso
| Superficie, km² | % de la superficie terrestre | Puesto mundial | |
|---|---|---|---|
| Tierras agrícolas | 70 | 18,0 % | 184/194 |
| Tierras cultivables | 20 | 5,1 % | 182/191 |
| Cultivos permanentes | 30 | 7,7 % | |
| Prados y pastos | 20 | 5,1 % | |
| Tierras cultivables por persona | 0,02 ha por persona | 169/191 |
Comparar las tierras agrícolas de San Vicente y las Granadinas con las de otros países
Fuentes:
- Banco Mundial | Agricultura y desarrollo rural (1961–2024, actualizado en octubre de 2026)
Creative Commons Atribución (CC BY): puedes copiar, compartir, adaptar y reutilizar este contenido, también con fines comerciales, siempre que cites a statistics.wiki e indiques los cambios que hayas hecho. Las fuentes indicadas arriba pueden tener sus propias condiciones de licencia.