
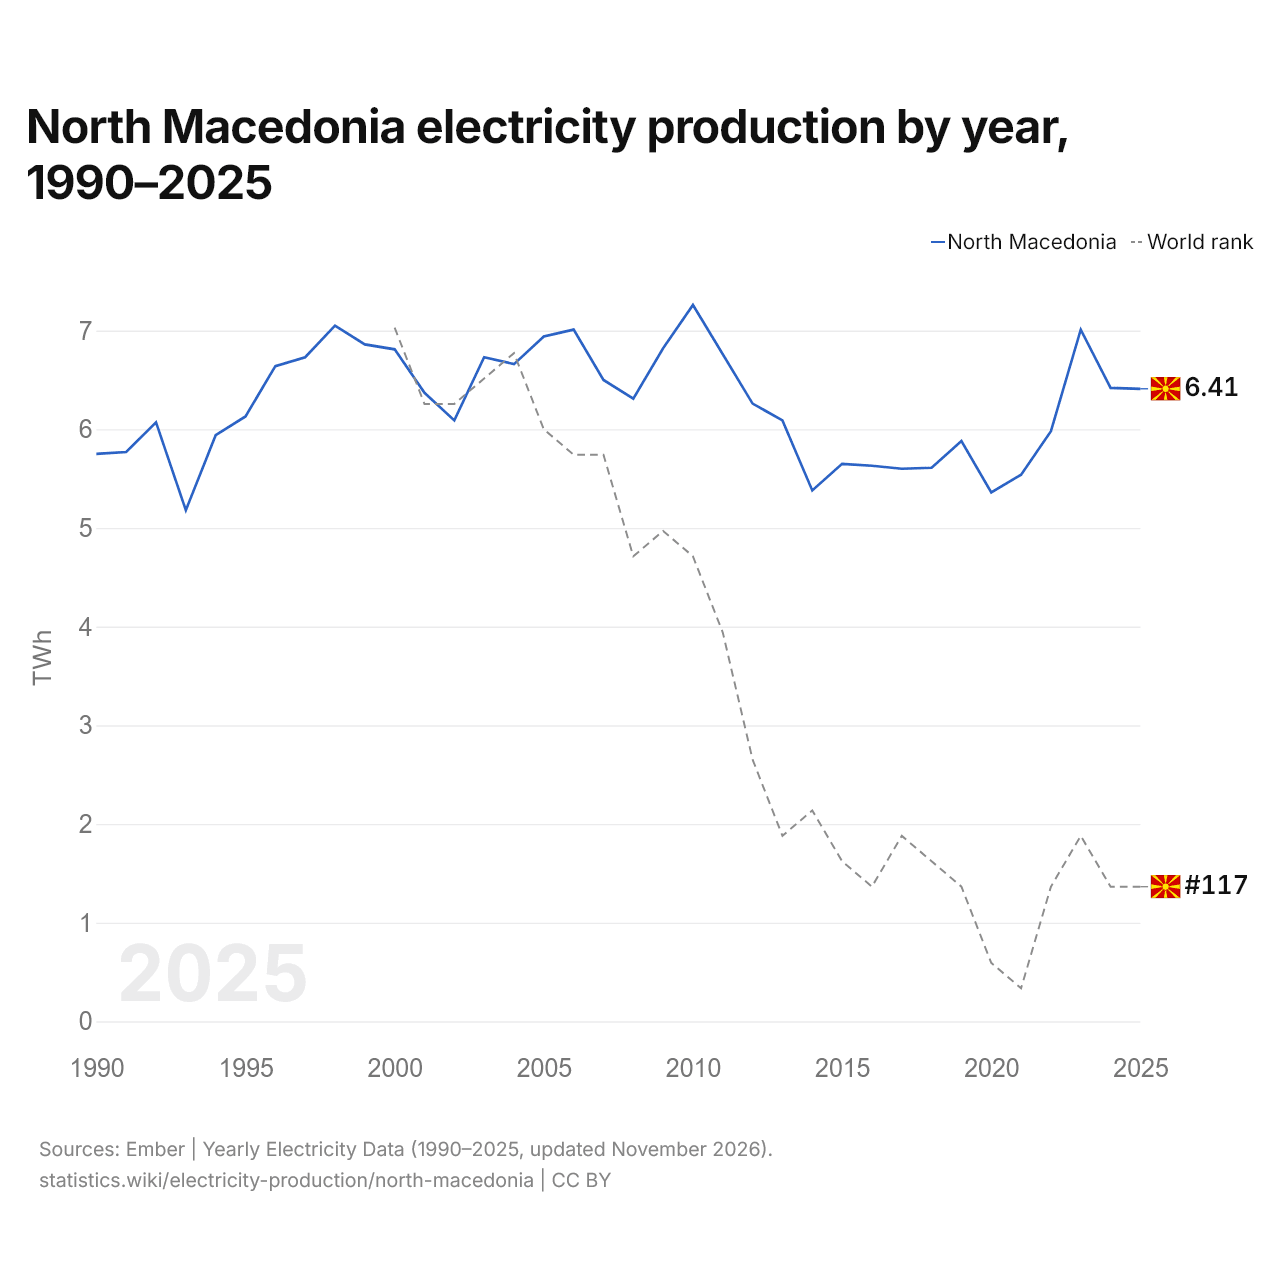
North Macedonia electricity production by year, 1990–2025
| Year | TWh | World rank |
|---|---|---|
| North Macedonia | ||
| 2025 | 6.41 | #117 |
| 2024 | 6.42 | #117 |
| 2023 | 7.01 | #115 |
| 2022 | 5.98 | #117 |
| 2021 | 5.54 | #121 |
| 2020 | 5.36 | #120 |
| 2019 | 5.88 | #117 |
| 2018 | 5.61 | #116 |
| 2017 | 5.6 | #115 |
| 2016 | 5.63 | #117 |
| 2015 | 5.65 | #116 |
| 2014 | 5.38 | #114 |
| 2013 | 6.09 | #115 |
| 2012 | 6.26 | #112 |
| 2011 | 6.76 | #107 |
| 2010 | 7.26 | #104 |
| 2009 | 6.82 | #103 |
| 2008 | 6.31 | #104 |
| 2007 | 6.5 | #100 |
| 2006 | 7.01 | #100 |
| 2005 | 6.94 | #99 |
| 2004 | 6.66 | #96 |
| 2003 | 6.73 | #97 |
| 2002 | 6.09 | #98 |
| 2001 | 6.37 | #98 |
| 2000 | 6.81 | #95 |
| 1999 | 6.86 | - |
| 1998 | 7.05 | - |
| 1997 | 6.73 | - |
| 1996 | 6.64 | - |
| 1995 | 6.13 | - |
| 1994 | 5.94 | - |
| 1993 | 5.18 | - |
| 1992 | 6.07 | - |
| 1991 | 5.77 | - |
| 1990 | 5.75 | - |
In 2025, North Macedonia produced 6.41 TWh of electricity, up from 5.75 TWh in 1990. Its production was highest in 2010, at 7.26 TWh. It was the 117th largest producer in the world, a rank it has held since 2024. Its highest rank was 95th, last held in 2000.
In 2025, North Macedonia's electricity production was the 33rd largest of 41 countries in Europe. Production per person in North Macedonia was 3,522 kWh in 2025. Electricity consumption in North Macedonia is 3,301 kWh per person, the 64th highest in the world.
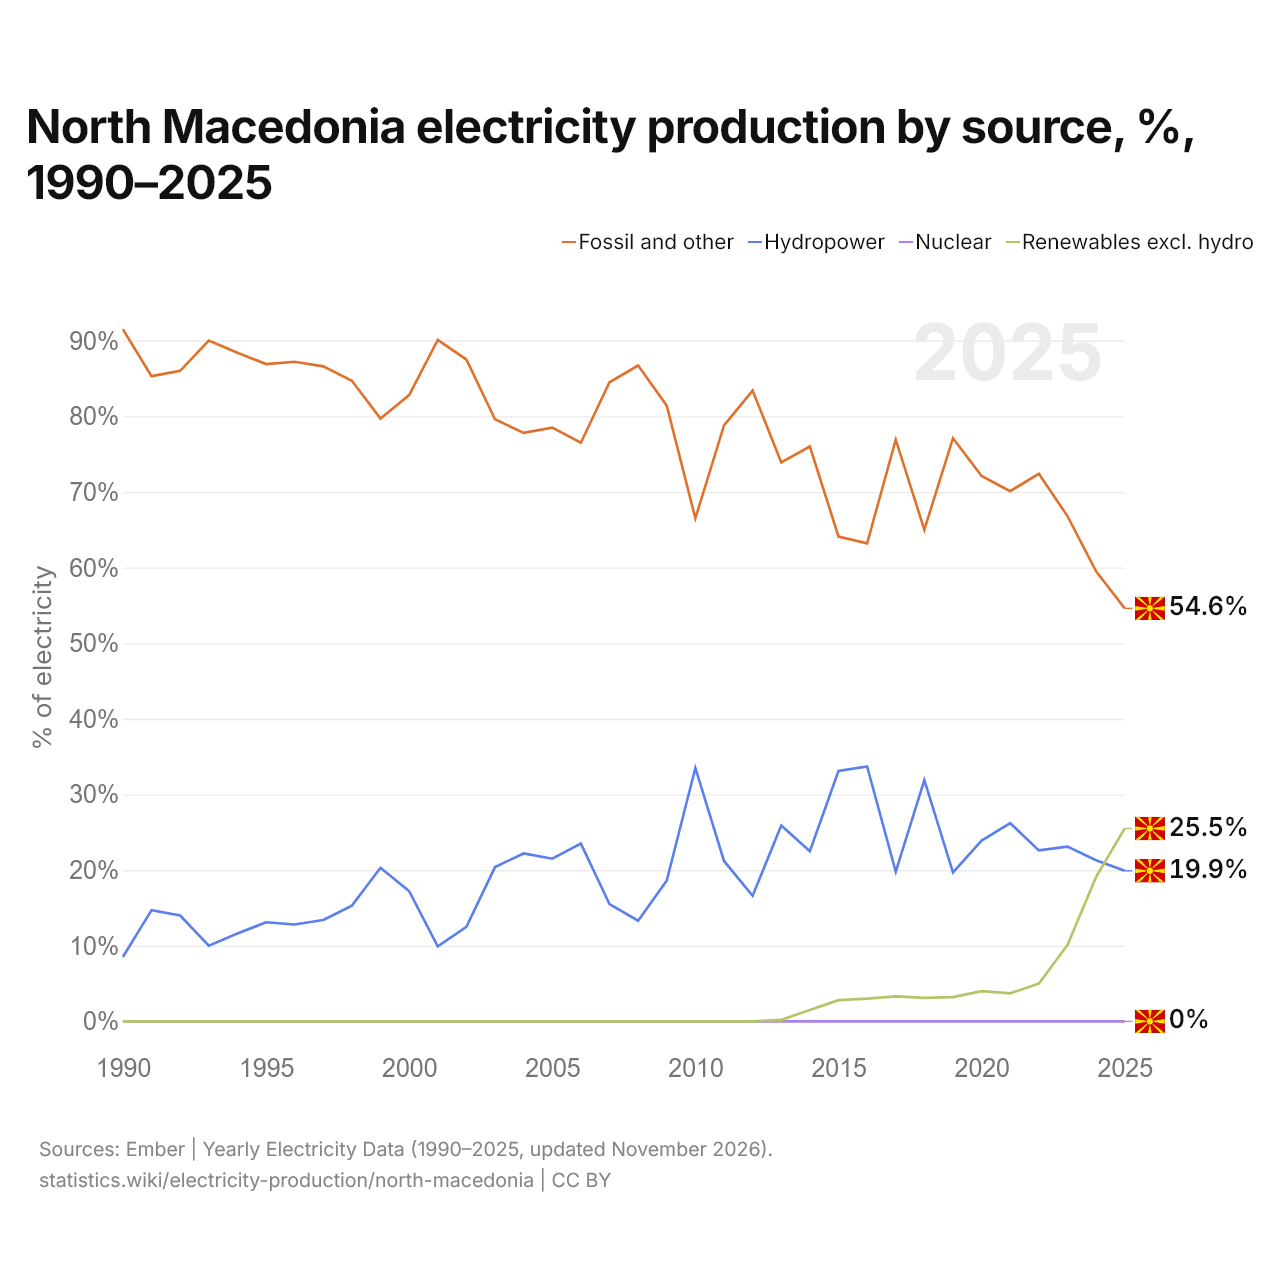
North Macedonia electricity production by source, %, 1990–2025
| Year | % of electricity | |||
|---|---|---|---|---|
| Fossil and other | Hydropower | Nuclear | Renewables excl. hydro | |
| 2025 | 54.6% | 19.9% | 0% | 25.5% |
| 2024 | 59.5% | 21.3% | 0% | 19.1% |
| 2023 | 66.8% | 23.1% | 0% | 10.1% |
| 2022 | 72.4% | 22.6% | 0% | 5% |
| 2021 | 70.1% | 26.2% | 0% | 3.7% |
| 2020 | 72.1% | 23.9% | 0% | 4% |
| 2019 | 77.1% | 19.7% | 0% | 3.2% |
| 2018 | 65% | 31.9% | 0% | 3.1% |
| 2017 | 76.9% | 19.8% | 0% | 3.3% |
| 2016 | 63.2% | 33.7% | 0% | 3% |
| 2015 | 64.1% | 33.1% | 0% | 2.8% |
| 2014 | 76% | 22.5% | 0% | 1.5% |
| 2013 | 73.9% | 25.9% | 0% | 0.2% |
| 2012 | 83.4% | 16.6% | 0% | 0% |
| 2011 | 78.8% | 21.2% | 0% | 0% |
| 2010 | 66.5% | 33.5% | 0% | 0% |
| 2009 | 81.4% | 18.6% | 0% | 0% |
| 2008 | 86.7% | 13.3% | 0% | 0% |
| 2007 | 84.5% | 15.5% | 0% | 0% |
| 2006 | 76.5% | 23.5% | 0% | 0% |
| 2005 | 78.5% | 21.5% | 0% | 0% |
| 2004 | 77.8% | 22.2% | 0% | 0% |
| 2003 | 79.6% | 20.4% | 0% | 0% |
| 2002 | 87.5% | 12.5% | 0% | 0% |
| 2001 | 90.1% | 9.9% | 0% | 0% |
| 2000 | 82.8% | 17.2% | 0% | 0% |
| 1999 | 79.7% | 20.3% | 0% | 0% |
| 1998 | 84.7% | 15.3% | 0% | 0% |
| 1997 | 86.6% | 13.4% | 0% | 0% |
| 1996 | 87.2% | 12.8% | 0% | 0% |
| 1995 | 86.9% | 13.1% | 0% | 0% |
| 1994 | 88.4% | 11.6% | 0% | 0% |
| 1993 | 90% | 10% | 0% | 0% |
| 1992 | 86% | 14% | 0% | 0% |
| 1991 | 85.3% | 14.7% | 0% | 0% |
| 1990 | 91.5% | 8.5% | 0% | 0% |
In 2025, fossil fuels and other sources produced 54.6% of North Macedonia's electricity, hydropower 19.9%, nuclear power 0.0% and the other renewables 25.5%. In 1990, North Macedonia's shares were 91.5%, 8.5%, 0.0% and 0.0%.
North Macedonia in the world electricity production ranking, 2025







Compare the electricity production of North Macedonia with other countries
Sources:
- Ember | Yearly Electricity Data (1990–2025, updated November 2026)
- World Bank | Health (2024–2025, updated October 2026)
Creative Commons Attribution (CC BY): you may copy, share, adapt and reuse this content, also commercially, as long as you credit statistics.wiki and note any changes you made. The sources listed above may have their own license terms.