
Peru: government spending on education as % of GDP
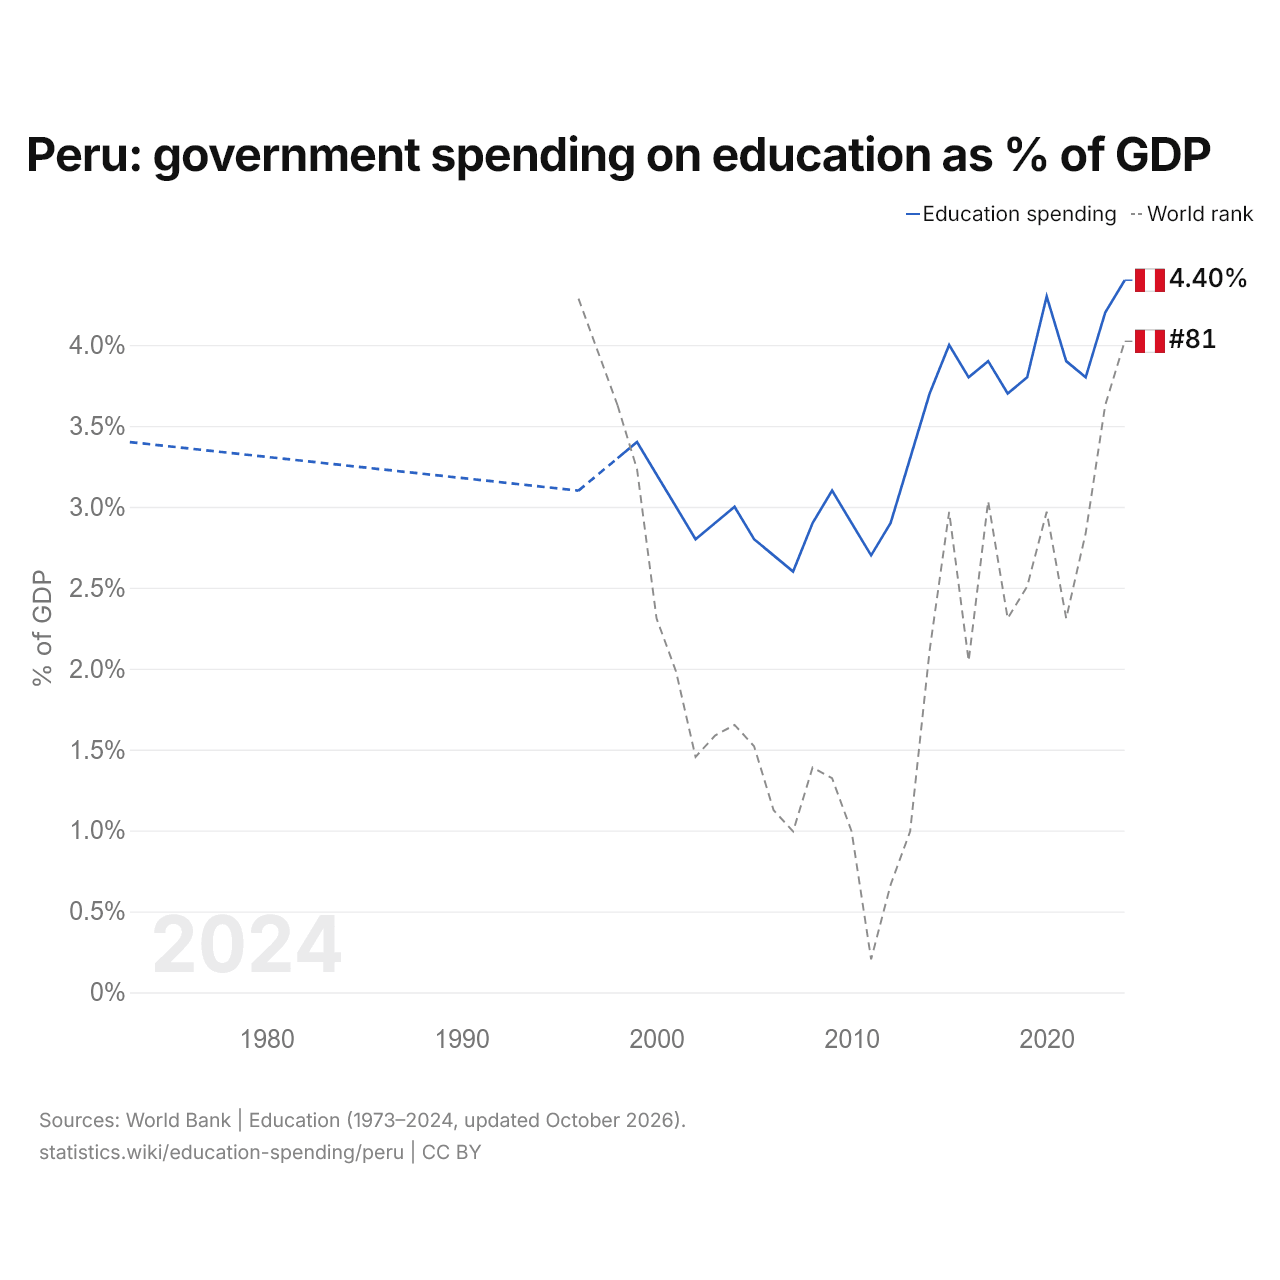
The government of Peru spends 4.4% of GDP on education, up from 3.4% in 1973. The share was lowest in 2007, at 2.6%. It is the 81st highest share in the world, up from 87th the year before. Its highest rank was 77th, last held in 1996.
Ten years earlier, in 2014, the government of Peru spent 3.7% of GDP on education, 0.7 percentage points less than now. Government spending on education in Peru, as a share of GDP, is the 16th highest of 33 countries in Latin America, where it ranges from Haiti's 1.0% to Cuba's 8.4% (2022).
Peru: government spending on education in US$
| Year | US$ |
|---|---|
| US$ | |
| 2024 | $12,713,918,675 |
| 2023 | $11,378,706,794 |
| 2022 | $9,452,307,628 |
| 2021 | $8,892,460,819 |
| 2020 | $8,578,803,982 |
| 2019 | $8,728,365,998 |
| 2018 | $8,267,075,123 |
| 2017 | $8,295,377,849 |
| 2016 | $7,317,400,863 |
| 2015 | $7,533,906,616 |
| 2014 | $7,421,039,915 |
| 2013 | $6,633,341,255 |
| 2012 | $5,630,697,792 |
| 2011 | $4,574,873,987 |
| 2010 | $4,230,059,828 |
| 2009 | $3,793,769,311 |
| 2008 | $3,457,089,741 |
| 2007 | $2,686,483,793 |
| 2006 | $2,351,535,576 |
| 2005 | $2,159,383,445 |
| 2004 | $1,974,931,455 |
| 2003 | $1,725,400,162 |
| 2002 | $1,545,039,237 |
| 2001 | $1,580,218,412 |
| 2000 | $1,670,336,008 |
| 1999 | $1,727,116,460 |
| 1998 | $1,819,437,955 |
| 1997 | - |
| 1996 | $1,723,212,250 |
| 1995 | - |
| 1994 | - |
| 1993 | - |
| 1992 | - |
| 1991 | - |
| 1990 | - |
| 1989 | - |
| 1988 | - |
| 1987 | - |
| 1986 | - |
| 1985 | - |
| 1984 | - |
| 1983 | - |
| 1982 | - |
| 1981 | - |
| 1980 | - |
| 1979 | - |
| 1978 | - |
| 1977 | - |
| 1976 | - |
| 1975 | - |
| 1974 | - |
| 1973 | $372,898,656 |
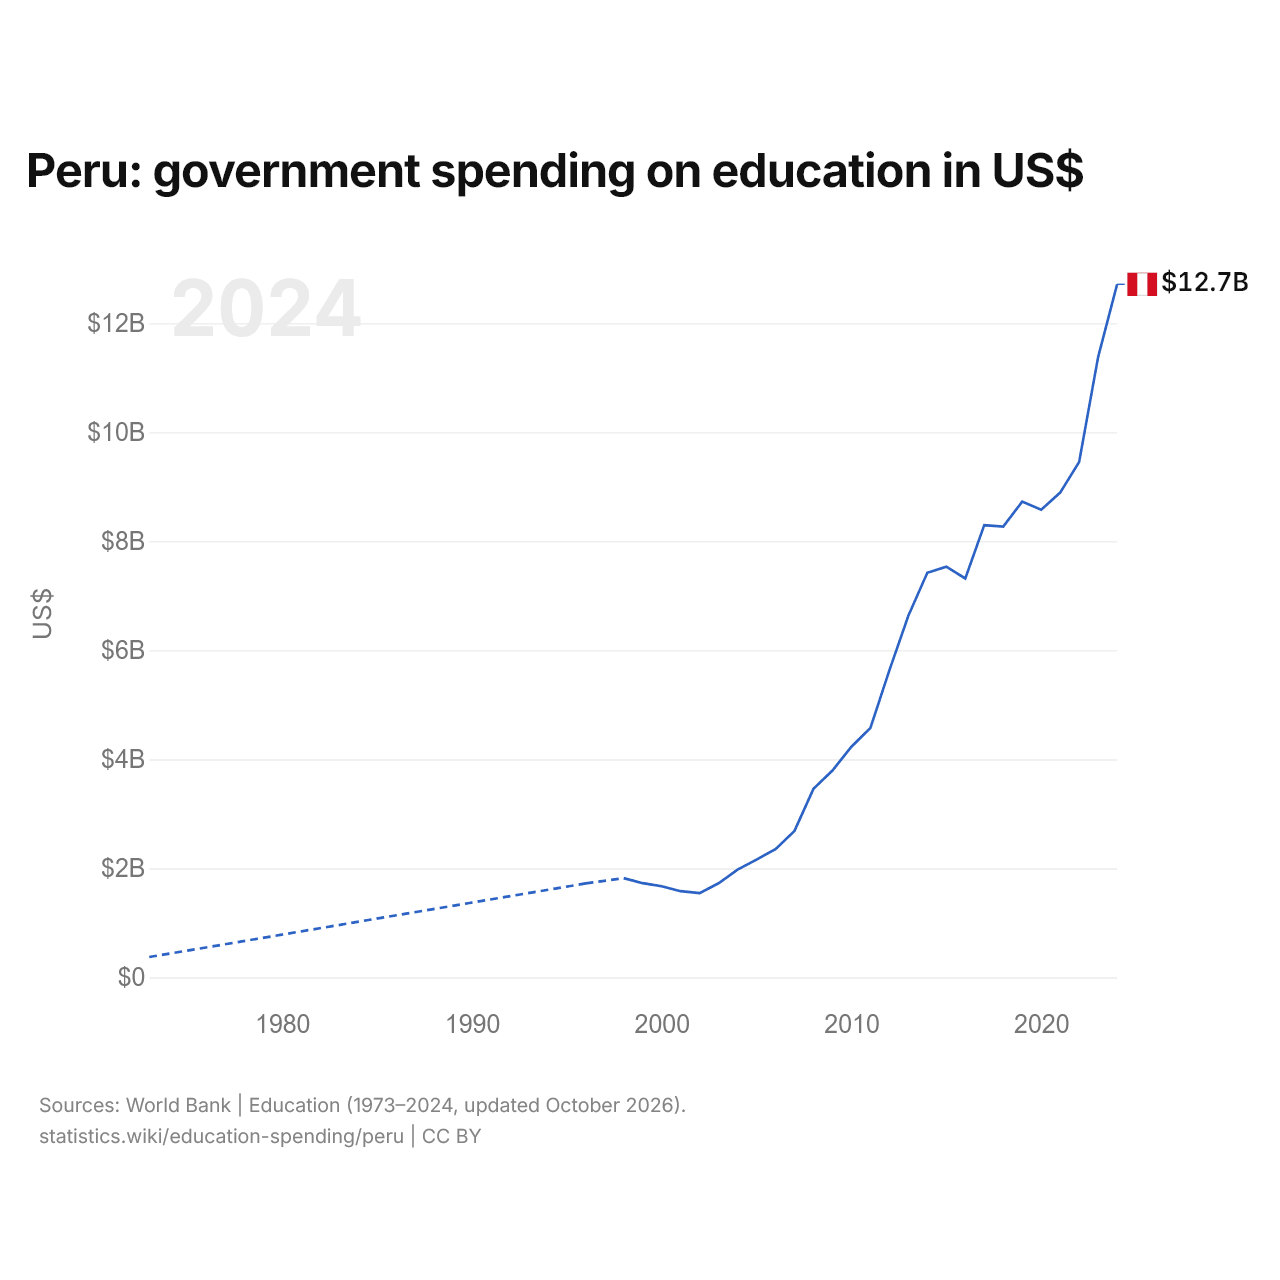
Government spending on education in Peru comes to $12.7 billion, up from $373 million in 1973. The government of Peru spends $372 per person on education.
Peru in the world ranking of education spending
| Rank | Country | % of GDP | US$ | Per person, US$ | |
|---|---|---|---|---|---|
| 78 |
 Saudi Arabia |
4.5% (2023) | $54.6B (2023) | $1,620 (2023) | |
| 79 |
 Seychelles |
4.5% (2023) | $96.7M (2023) | $808 (2023) | |
| 80 |
 Oman |
4.4% (2022) | $4.81B (2022) | $1,018 (2022) | |
| 81 |
 Peru |
4.4% | $12.7B | $372 | |
| 82 |
 Cape Verde |
4.3% (2023) | $109M (2023) | $208 (2023) | |
| 83 |
 Latvia |
4.3% (2022) | $1.64B (2022) | $873 (2022) | |
| 84 |
 Poland |
4.3% (2022) | $30.0B (2022) | $815 (2022) | vs Poland |
Compare the education spending of Peru with other countries
Sources:
- World Bank | Education (1973–2024, updated October 2026)
Creative Commons Attribution (CC BY): you may copy, share, adapt and reuse this content, also commercially, as long as you credit statistics.wiki and note any changes you made. The sources listed above may have their own license terms.