
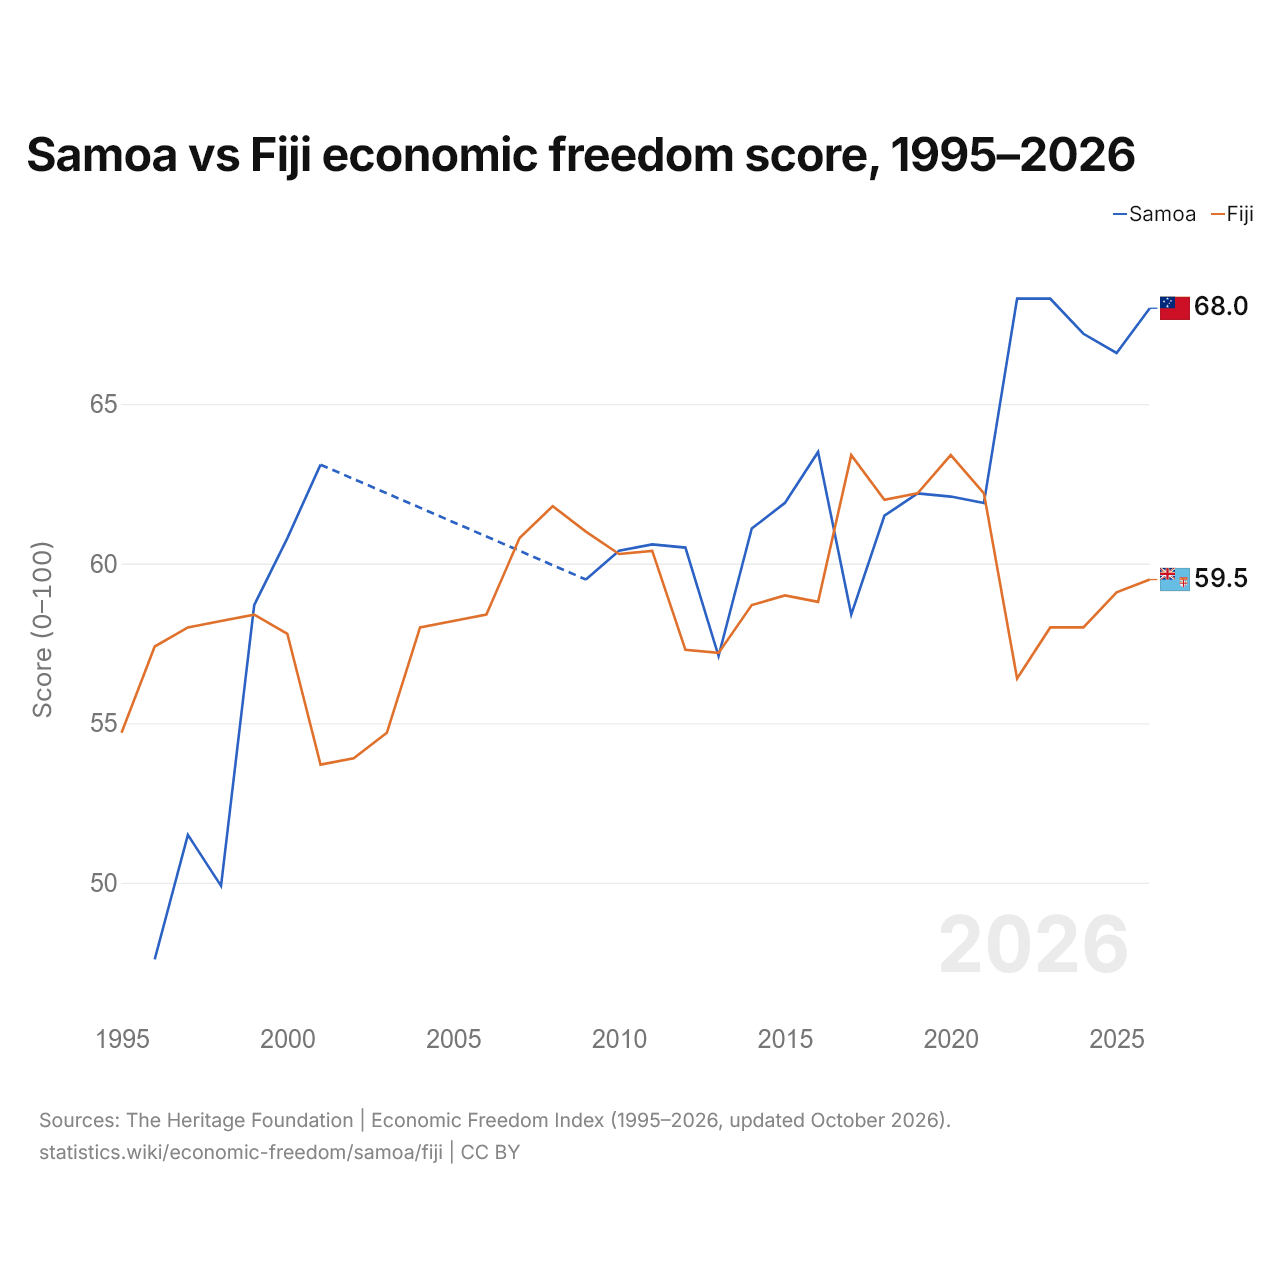
Samoa vs Fiji economic freedom score, 1995–2026
1x
| Year | Score (0–100) | |
|---|---|---|
 Samoa |
 Fiji |
|
| 2026 | 68 | 59.5 |
| 2025 | 66.6 | 59.1 |
| 2024 | 67.2 | 58 |
| 2023 | 68.3 | 58 |
| 2022 | 68.3 | 56.4 |
| 2021 | 61.9 | 62.2 |
| 2020 | 62.1 | 63.4 |
| 2019 | 62.2 | 62.2 |
| 2018 | 61.5 | 62 |
| 2017 | 58.4 | 63.4 |
| 2016 | 63.5 | 58.8 |
| 2015 | 61.9 | 59 |
| 2014 | 61.1 | 58.7 |
| 2013 | 57.1 | 57.2 |
| 2012 | 60.5 | 57.3 |
| 2011 | 60.6 | 60.4 |
| 2010 | 60.4 | 60.3 |
| 2009 | 59.5 | 61 |
| 2008 | - | 61.8 |
| 2007 | - | 60.8 |
| 2006 | - | 58.4 |
| 2005 | - | 58.2 |
| 2004 | - | 58 |
| 2003 | - | 54.7 |
| 2002 | - | 53.9 |
| 2001 | 63.1 | 53.7 |
| 2000 | 60.8 | 57.8 |
| 1999 | 58.7 | 58.4 |
| 1998 | 49.9 | 58.2 |
| 1997 | 51.5 | 58 |
| 1996 | 47.6 | 57.4 |
| 1995 | - | 54.7 |
In the 2026 index, the score is 68 for Samoa and 59.5 for Fiji: 8.5 points higher for Samoa. In 1996, it was 47.6 for Samoa and 57.4 for Fiji, 9.8 points higher for Fiji.
Samoa vs Fiji: Index of Economic Freedom
|
Samoa
|
Fiji
|
|
|---|---|---|
| Score (0–100) | 68 | 59.5 |
| Category | Moderately free | Mostly unfree |
| World rank | 44/174 | 91/174 |
| Change over 10 years | +4.5 | +0.7 |
| Property rights | 77.1 | 59.9 |
| Judicial effectiveness | 77.6 | 53.2 |
| Government integrity | 64.1 | 55.4 |
| Tax burden | 79.3 | 87.8 |
| Government spending | 75.2 | 70 |
| Fiscal health | 98.7 | 7.5 |
| Business freedom | 63.7 | 69.5 |
| Labor freedom | 73.7 | 66.9 |
| Monetary freedom | 69.4 | 72.4 |
| Trade freedom | 67.2 | 66.6 |
| Investment freedom | 40 | 55 |
| Financial freedom | 30 | 50 |
Compare the economic freedom of any 2 countries
Sources:
- The Heritage Foundation | Economic Freedom Index (1995–2026, updated October 2026)
Creative Commons Attribution (CC BY): you may copy, share, adapt and reuse this content, also commercially, as long as you credit statistics.wiki and note any changes you made. The sources listed above may have their own license terms.