
Netherlands death rate
| Year | Deaths per 1,000 people | World rank |
|---|---|---|
| Netherlands | ||
| 2024 | 9.6 | #44 |
| 2023 | 9.5 | #45 |
| 2022 | 9.6 | #49 |
| 2021 | 9.8 | #57 |
| 2020 | 9.7 | #49 |
| 2019 | 8.8 | #60 |
| 2018 | 8.9 | #59 |
| 2017 | 8.8 | #65 |
| 2016 | 8.7 | #70 |
| 2015 | 8.7 | #72 |
| 2014 | 8.3 | #75 |
| 2013 | 8.4 | #74 |
| 2012 | 8.4 | #77 |
| 2011 | 8.1 | #84 |
| 2010 | 8.2 | #86 |
| 2009 | 8.1 | #90 |
| 2008 | 8.2 | #92 |
| 2007 | 8.1 | #97 |
| 2006 | 8.3 | #94 |
| 2005 | 8.4 | #95 |
| 2004 | 8.4 | #92 |
| 2003 | 8.7 | #93 |
| 2002 | 8.8 | #91 |
| 2001 | 8.7 | #92 |
| 2000 | 8.8 | #94 |
| 1999 | 8.9 | #94 |
| 1998 | 8.8 | #98 |
| 1997 | 8.7 | #100 |
| 1996 | 8.9 | #100 |
| 1995 | 8.8 | #103 |
| 1994 | 8.7 | #102 |
| 1993 | 9 | #98 |
| 1992 | 8.6 | #102 |
| 1991 | 8.6 | #105 |
| 1990 | 8.6 | #105 |
| 1989 | 8.7 | #105 |
| 1988 | 8.4 | #115 |
| 1987 | 8.3 | #118 |
| 1986 | 8.6 | #116 |
| 1985 | 8.5 | #120 |
| 1984 | 8.3 | #127 |
| 1983 | 8.2 | #130 |
| 1982 | 8.2 | #131 |
| 1981 | 8.1 | #133 |
| 1980 | 8.1 | #138 |
| 1979 | 8 | #141 |
| 1978 | 8.2 | #139 |
| 1977 | 7.9 | #148 |
| 1976 | 8.3 | #142 |
| 1975 | 8.3 | #144 |
| 1974 | 8.1 | #152 |
| 1973 | 8.2 | #150 |
| 1972 | 8.5 | #145 |
| 1971 | 8.4 | #152 |
| 1970 | 8.4 | #154 |
| 1969 | 8.4 | #155 |
| 1968 | 8.2 | #162 |
| 1967 | 7.9 | #171 |
| 1966 | 8.1 | #168 |
| 1965 | 8 | #173 |
| 1964 | 7.7 | #182 |
| 1963 | 8 | #178 |
| 1962 | 7.9 | #183 |
| 1961 | 7.6 | #184 |
| 1960 | 7.6 | #185 |
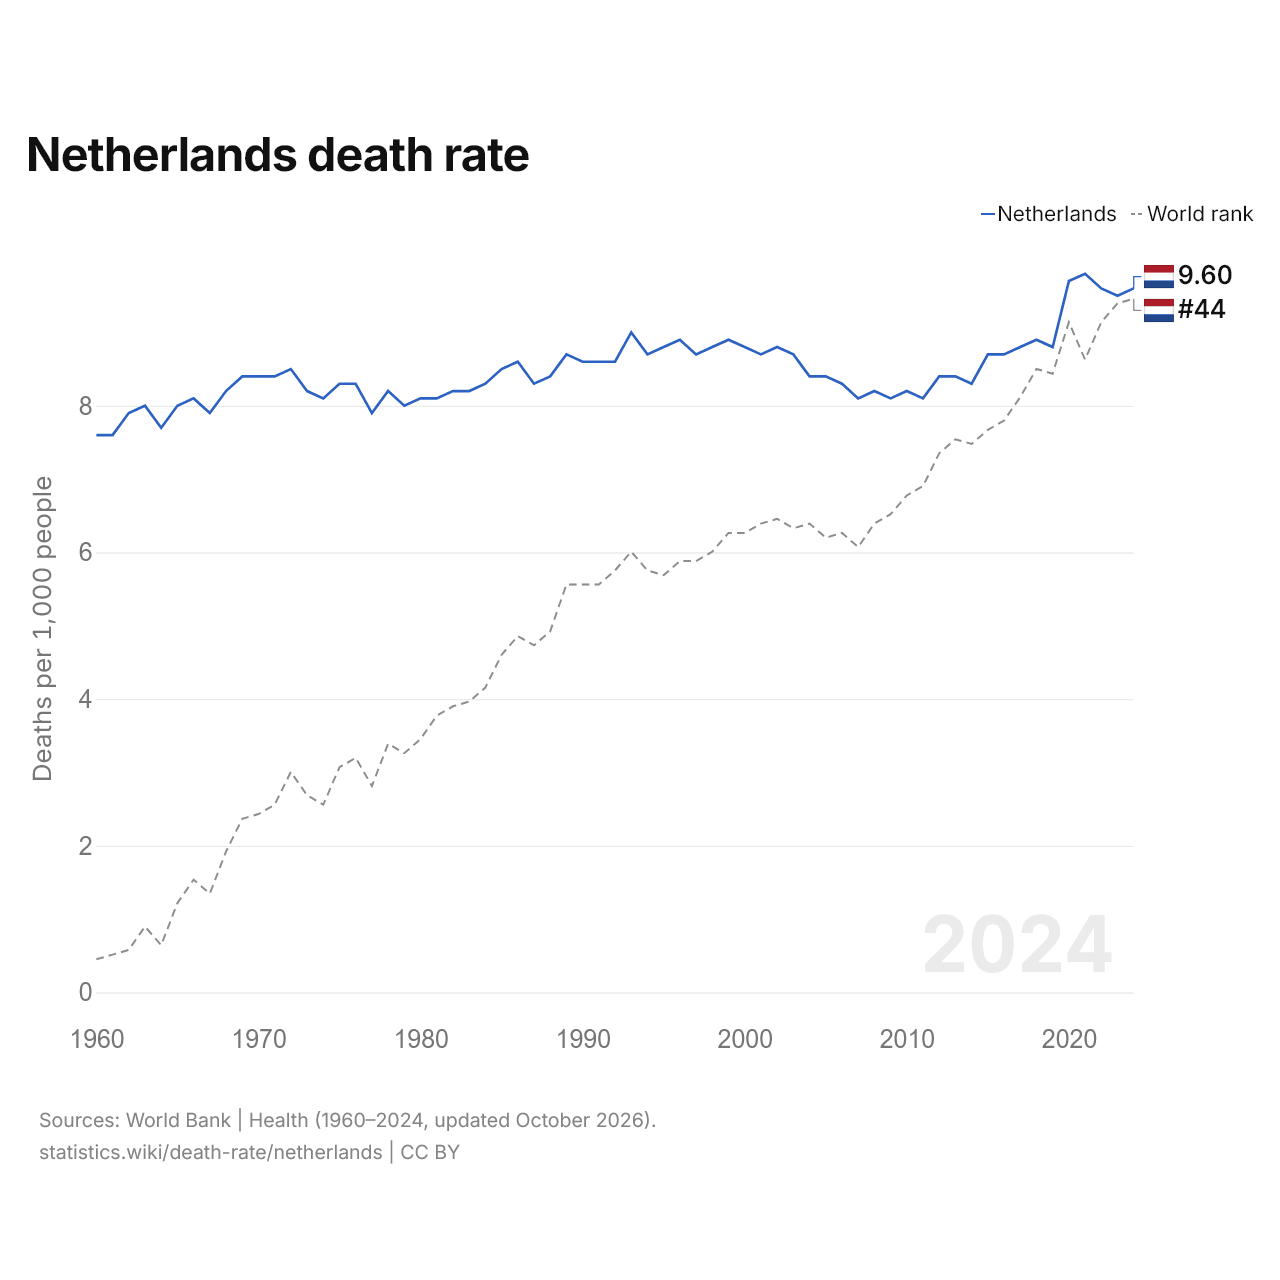
The death rate in the Netherlands is 9.6 deaths per 1,000 people, up from 7.6 in 1960. It was highest in 2021, at 9.8. It is the 44th highest in the world, up from 45th the year before.
The Netherlands' death rate is the 27th highest of 44 countries in Europe, where it ranges from Andorra's 6.1 to Monaco's 20.1. The largest ten-year rise in the Netherlands' death rate was from 2010 to 2020, by 1.5 deaths per 1,000 people; the largest ten-year fall was from 2000 to 2010, by 0.6.
Netherlands in the world death rate ranking
| Rank | Country | Deaths per 1,000 people | Deaths per year | Deaths per day | Median age, years | |
|---|---|---|---|---|---|---|
| 42 |
 Somalia |
9.7 | 185,168 | 507 | 16.6 | |
| 43 |
 United Kingdom |
9.7 | 672,094 | 1,840 | 41.0 | vs UK |
| 44 |
 Austria |
9.6 | 88,108 | 241.2 | 44.4 | vs Austria |
| 44 |
 Netherlands |
9.6 | 172,737 | 473 | 42.4 | |
| 46 |
 Fiji |
9.5 | 8,833 | 24.2 | 28.9 | |
| 47 |
 Belgium |
9.5 | 112,656 | 308 | 42.7 | vs Belgium |
| 47 |
 Denmark |
9.5 | 56,781 | 155.5 | 42.3 | vs Denmark |
Deaths in the Netherlands per year
| Year | Deaths per year |
|---|---|
| Netherlands | |
| 2024 | 172,737 |
| 2023 | 169,832 |
| 2022 | 169,929 |
| 2021 | 171,823 |
| 2020 | 169,182 |
| 2019 | 152,634 |
| 2018 | 153,361 |
| 2017 | 150,755 |
| 2016 | 148,163 |
| 2015 | 147,377 |
| 2014 | 139,979 |
| 2013 | 141,157 |
| 2012 | 140,741 |
| 2011 | 135,213 |
| 2010 | 136,246 |
| 2009 | 133,896 |
| 2008 | 134,853 |
| 2007 | 132,691 |
| 2006 | 135,672 |
| 2005 | 137,086 |
| 2004 | 136,766 |
| 2003 | 141,160 |
| 2002 | 142,110 |
| 2001 | 139,601 |
| 2000 | 140,144 |
| 1999 | 140,727 |
| 1998 | 138,223 |
| 1997 | 135,812 |
| 1996 | 138,221 |
| 1995 | 136,039 |
| 1994 | 133,830 |
| 1993 | 137,613 |
| 1992 | 130,583 |
| 1991 | 129,600 |
| 1990 | 128,582 |
| 1989 | 129,185 |
| 1988 | 123,984 |
| 1987 | 121,719 |
| 1986 | 125,321 |
| 1985 | 123,178 |
| 1984 | 119,720 |
| 1983 | 117,809 |
| 1982 | 117,364 |
| 1981 | 115,402 |
| 1980 | 114,613 |
| 1979 | 112,306 |
| 1978 | 114,321 |
| 1977 | 109,463 |
| 1976 | 114,324 |
| 1975 | 113,430 |
| 1974 | 109,714 |
| 1973 | 110,202 |
| 1972 | 113,293 |
| 1971 | 110,833 |
| 1970 | 109,523 |
| 1969 | 108,175 |
| 1968 | 104,383 |
| 1967 | 99,525 |
| 1966 | 100,895 |
| 1965 | 98,357 |
| 1964 | 93,378 |
| 1963 | 95,727 |
| 1962 | 93,264 |
| 1961 | 88,454 |
| 1960 | 87,298 |
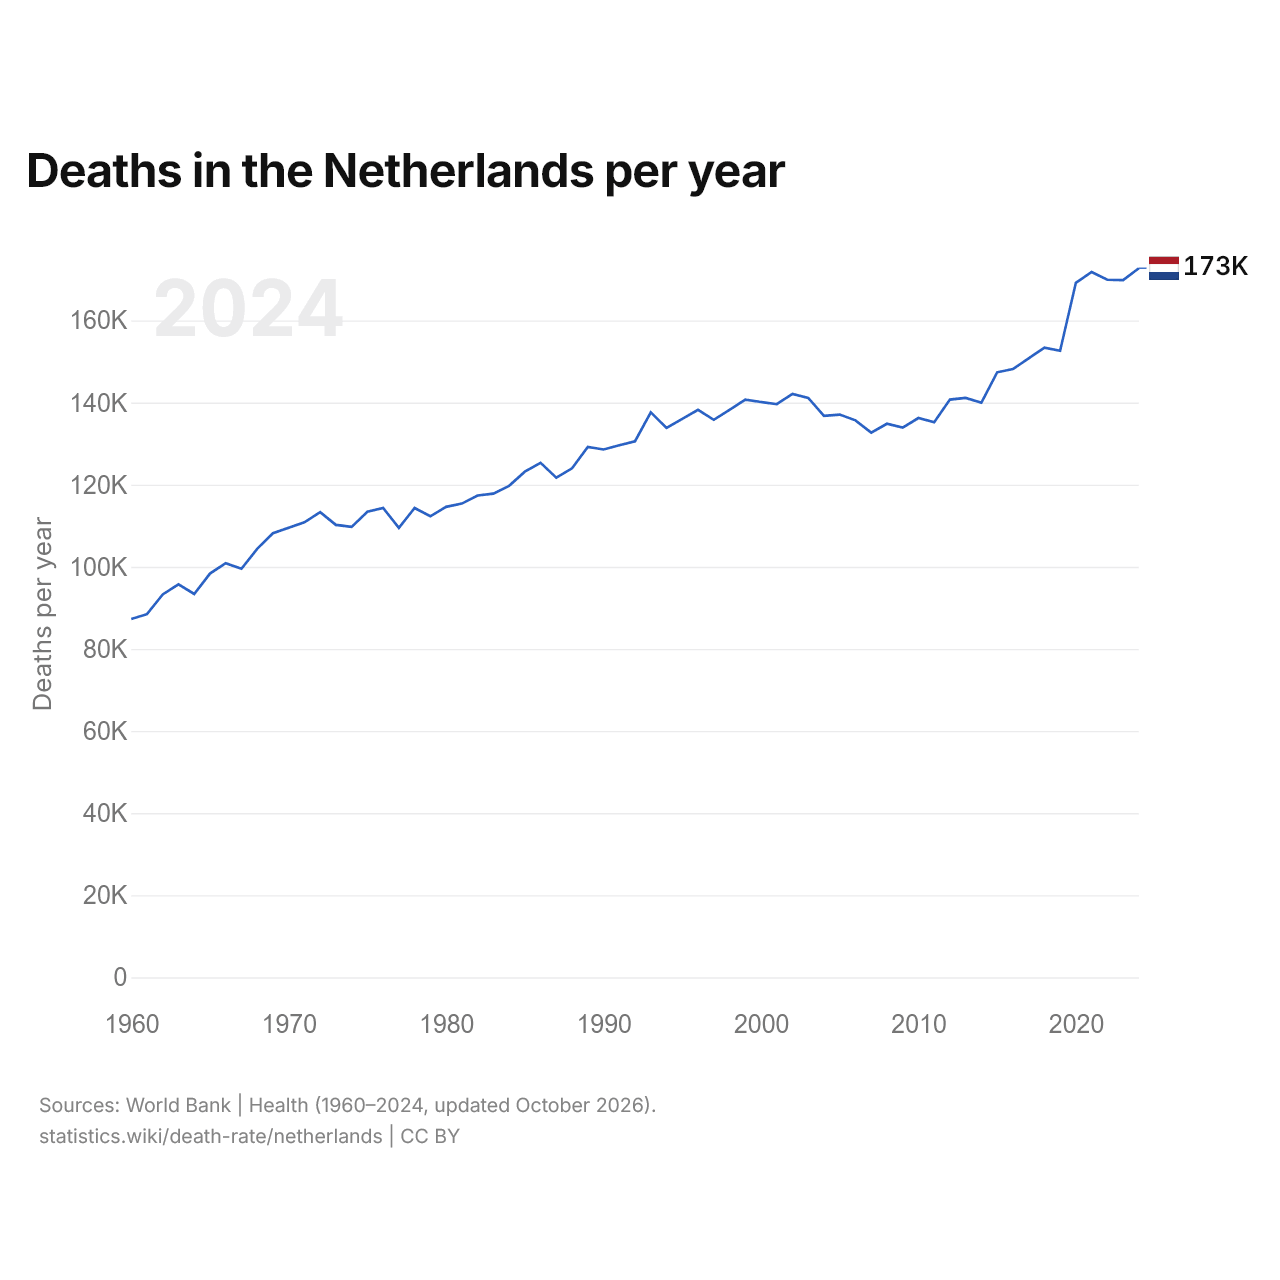
In the Netherlands, 173,000 people die a year, up from 87,300 in 1960.
Since 1960, a total of 8.32 million people have died in the Netherlands. By decade, the Netherlands had the most deaths from 2010 to 2019, 1.45 million, and the fewest from 1960 to 1969, 969,000.
Compare the Netherlands death rate with other countries
Sources:
- World Bank | Health (1960–2024, updated October 2026)
Creative Commons Attribution (CC BY): you may copy, share, adapt and reuse this content, also commercially, as long as you credit statistics.wiki and note any changes you made. The sources listed above may have their own license terms.