
Japan child mortality rate (under 5), 1960–2026
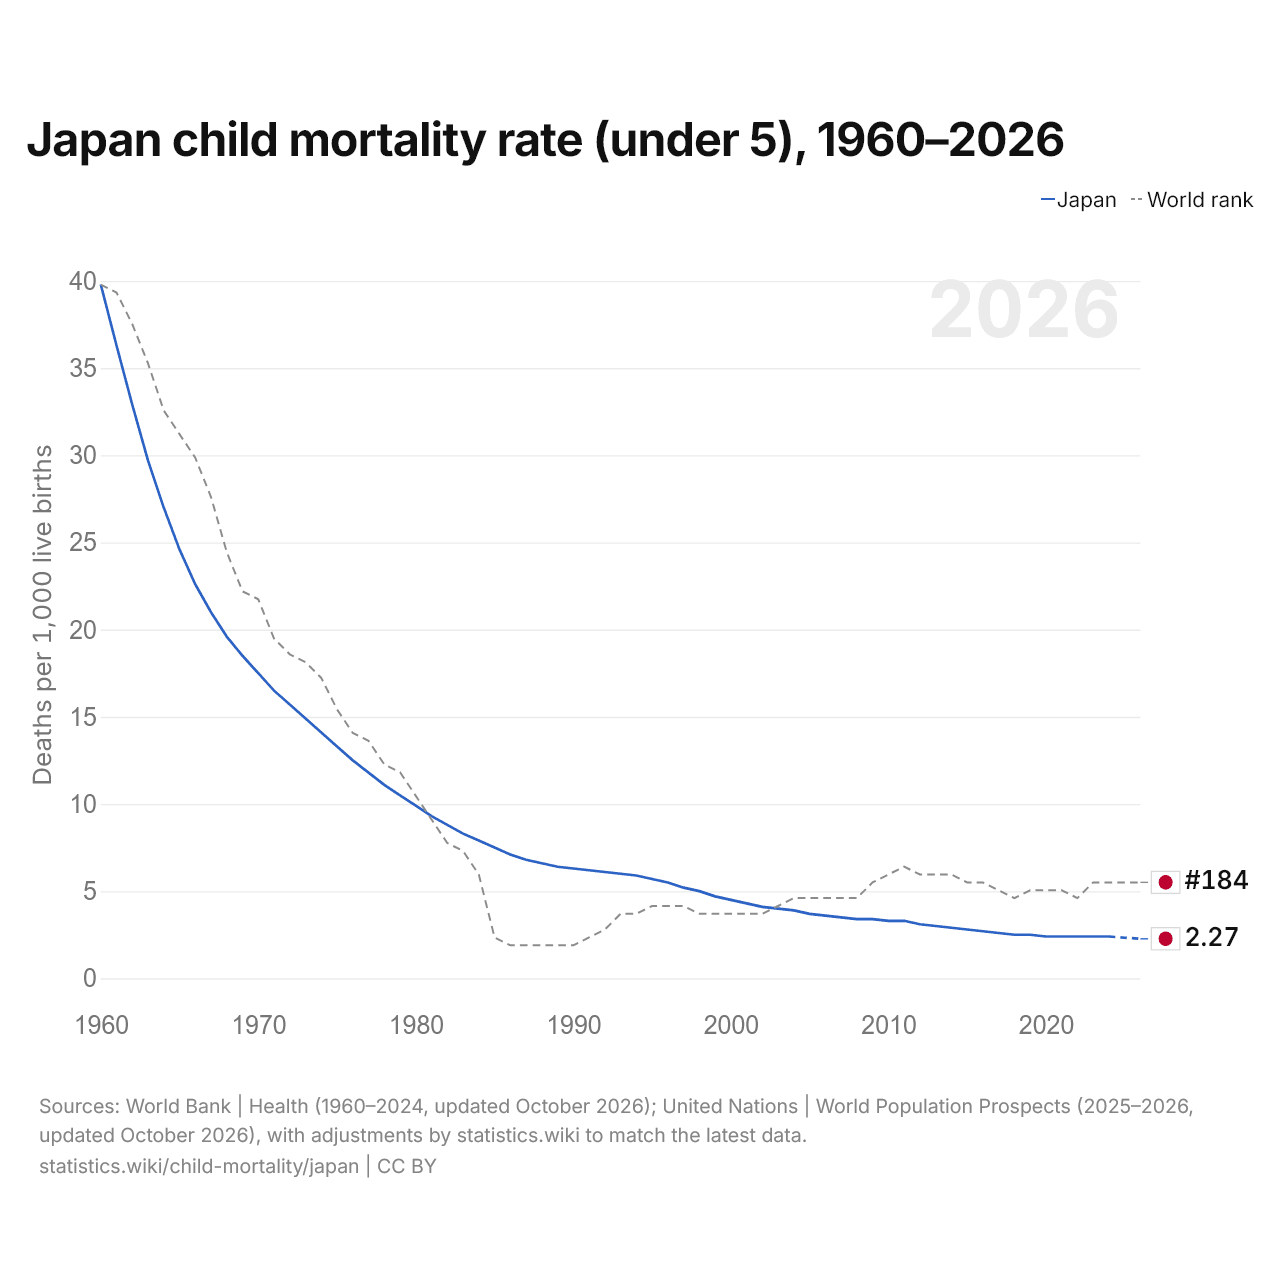
| Year | Deaths per 1,000 live births | World rank |
|---|---|---|
| Japan | ||
| 2026 projected | 2.27 | #184 |
| 2025 projected | 2.33 | #184 |
| 2024 | 2.4 | #184 |
| 2023 | 2.4 | #184 |
| 2022 | 2.4 | #186 |
| 2021 | 2.4 | #185 |
| 2020 | 2.4 | #185 |
| 2019 | 2.5 | #185 |
| 2018 | 2.5 | #186 |
| 2017 | 2.6 | #185 |
| 2016 | 2.7 | #184 |
| 2015 | 2.8 | #184 |
| 2014 | 2.9 | #183 |
| 2013 | 3 | #183 |
| 2012 | 3.1 | #183 |
| 2011 | 3.3 | #182 |
| 2010 | 3.3 | #183 |
| 2009 | 3.4 | #184 |
| 2008 | 3.4 | #186 |
| 2007 | 3.5 | #186 |
| 2006 | 3.6 | #186 |
| 2005 | 3.7 | #186 |
| 2004 | 3.9 | #186 |
| 2003 | 4 | #187 |
| 2002 | 4.1 | #188 |
| 2001 | 4.3 | #188 |
| 2000 | 4.5 | #188 |
| 1999 | 4.7 | #188 |
| 1998 | 5 | #188 |
| 1997 | 5.2 | #187 |
| 1996 | 5.5 | #187 |
| 1995 | 5.7 | #187 |
| 1994 | 5.9 | #188 |
| 1993 | 6 | #188 |
| 1992 | 6.1 | #190 |
| 1991 | 6.2 | #191 |
| 1990 | 6.3 | #192 |
| 1989 | 6.4 | #192 |
| 1988 | 6.6 | #192 |
| 1987 | 6.8 | #192 |
| 1986 | 7.1 | #192 |
| 1985 | 7.5 | #191 |
| 1984 | 7.9 | #183 |
| 1983 | 8.3 | #180 |
| 1982 | 8.8 | #179 |
| 1981 | 9.3 | #176 |
| 1980 | 9.9 | #173 |
| 1979 | 10.5 | #170 |
| 1978 | 11.1 | #169 |
| 1977 | 11.8 | #166 |
| 1976 | 12.5 | #165 |
| 1975 | 13.3 | #162 |
| 1974 | 14.1 | #158 |
| 1973 | 14.9 | #156 |
| 1972 | 15.7 | #155 |
| 1971 | 16.5 | #153 |
| 1970 | 17.5 | #148 |
| 1969 | 18.5 | #147 |
| 1968 | 19.6 | #142 |
| 1967 | 21 | #135 |
| 1966 | 22.6 | #130 |
| 1965 | 24.6 | #127 |
| 1964 | 27 | #124 |
| 1963 | 29.7 | #118 |
| 1962 | 32.9 | #113 |
| 1961 | 36.3 | #109 |
| 1960 | 39.8 | #108 |
In 2026, Japan's child mortality rate is 2.3 deaths per 1,000 live births, down from 39.8 in 1960. It is the 184th highest in the world, a rank it has held since 2023. Its highest rank was 108th, last held in 1960.
Japan's child mortality rate is the lowest of 47 countries in Asia, behind Singapore's 2.6. The largest ten-year fall in Japan's child mortality rate was from 1960 to 1970, by 22.3 deaths per 1,000 live births.
The first measles dose reaches 95% of children aged 12–23 months in Japan.
Japan in the world child mortality ranking, 2026
| Rank | Country | Per 1,000 live births | Change since 1990 | |
|---|---|---|---|---|
| 181 |
 Andorra |
2.4 | −81.8% | |
| 182 |
 Latvia |
2.4 | −86.0% | |
| 183 |
 Norway |
2.3 | −73.3% | vs Norway |
| 184 |
 Japan |
2.3 | −63.9% | |
| 185 |
 Sweden |
2.3 | −67.7% | vs Sweden |
| 186 |
 Finland |
2.3 | −66.4% | vs Finland |
| 187 |
 Montenegro |
2.3 | −86.4% |
Compare the Japan child mortality rate with other countries
Sources:
- World Bank | Health (1960–2024, updated October 2026)
- United Nations | World Population Prospects (2025–2026, updated October 2026), with adjustments by statistics.wiki to match the latest data
Creative Commons Attribution (CC BY): you may copy, share, adapt and reuse this content, also commercially, as long as you credit statistics.wiki and note any changes you made. The sources listed above may have their own license terms.