
List of countries by share of births outside marriage
| Rank | Country | % of all births | Change since 2000, points |
|---|---|---|---|
| 1 |  Chile |
75.1% (2019) | n/a |
| 2 |  Costa Rica |
72.5% | +19.8 |
| 3 |  Mexico |
70.4% | +28.8 |
| 4 |  Iceland |
69.4% (2019) | +4.2 |
| 5 |  France |
62.2% | +18.6 |
| 6 |  Norway |
58.5% | +8.9 |
| 7 |  Portugal |
57.9% | +35.7 |
| 8 |  Slovenia |
56.5% | +19.4 |
| 9 |  Sweden |
55.2% | −0.1 |
| 10 |  Denmark |
54.2% | +9.6 |
| 11 |  Estonia |
53.7% (2019) | −0.8 |
| 12 |  Netherlands |
53.5% | +28.6 |
| 13 |  Belgium |
52.4% (2018) | +24.4 |
| 14 |  United Kingdom |
51.3% (2021) | +11.8 |
| 15 |  New Zealand |
48.7% (2021) | +5.5 |
| 16 |  Czech Republic |
48.5% | +26.7 |
| 17 |  Spain |
47.6% | +29.9 |
| 18 |  Finland |
46.1% | +6.9 |
| 19 |  Luxembourg |
41.6% | +19.7 |
| 20 |  Austria |
41.2% | +9.9 |
| 21 |  Slovakia |
40.7% | +22.4 |
| 22 |  United States |
40.5% | +7.3 |
| 23 |  Latvia |
39.5% | −0.9 |
| 24 |  Ireland |
38.4% (2019) | +6.9 |
| 25 |  Australia |
36.5% | +7.3 |
| 26 |  Italy |
33.8% | +24.6 |
| 27 |  Germany |
33.1% | +9.7 |
| 28 |  Canada |
32.7% | +1.0 |
| 29 |  Hungary |
30.4% | +1.4 |
| 30 |  Switzerland |
27.7% | +17.0 |
| 31 |  Lithuania |
27.0% | +4.4 |
| 32 |  Poland |
26.4% | +14.3 |
| 33 |  Greece |
13.8% | +9.8 |
| 34 |  Israel |
8.1% (2019) | n/a |
| 35 |  South Korea |
3.0% (2021) | +1.8 |
| 36 |  Turkey |
2.8% | n/a |
| 37 |  Japan |
2.4% | +0.8 |
Of the 37 countries in the table, the latest share of births outside marriage is highest in Chile, 75.1% of all births (2019), and lowest in Japan, 2.4%. In half of them it is below 41.6%.
Births outside marriage, also called births out of wedlock, are the children born to mothers who are not married, including mothers who live with a partner, as a share of all live births. The figures are the OECD's, from national statistics.
Births outside marriage by country map, % of all births
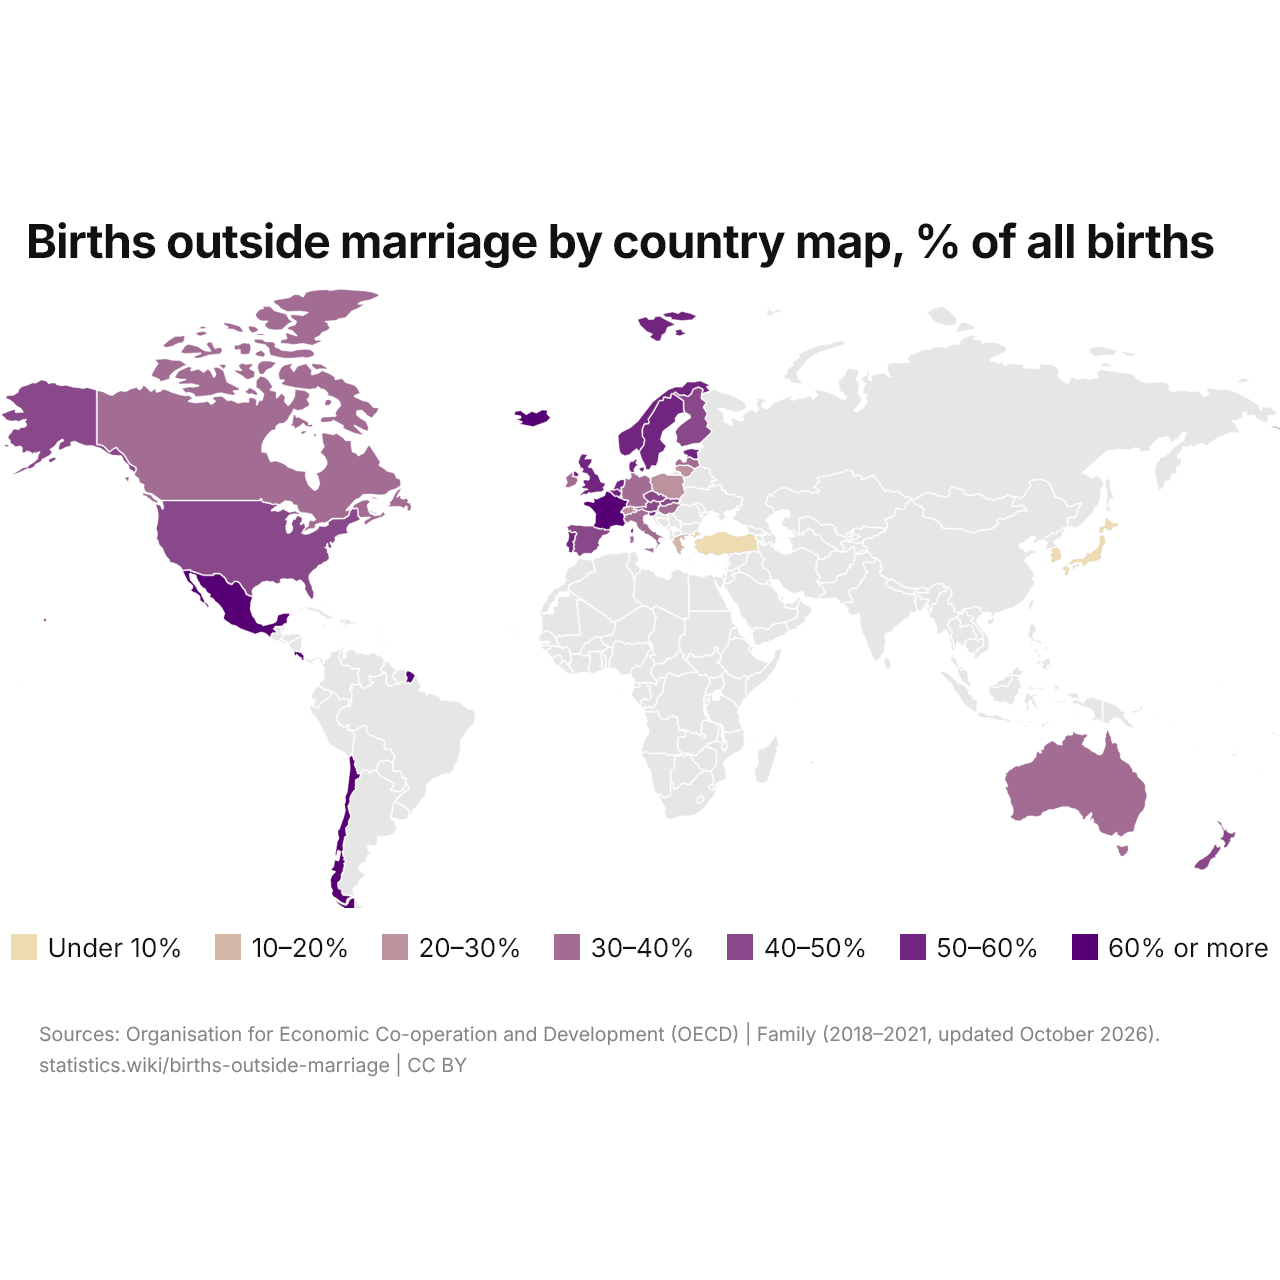
In 14 of the 37 countries, 50% or more of all births are outside marriage; in four, less than 10%.
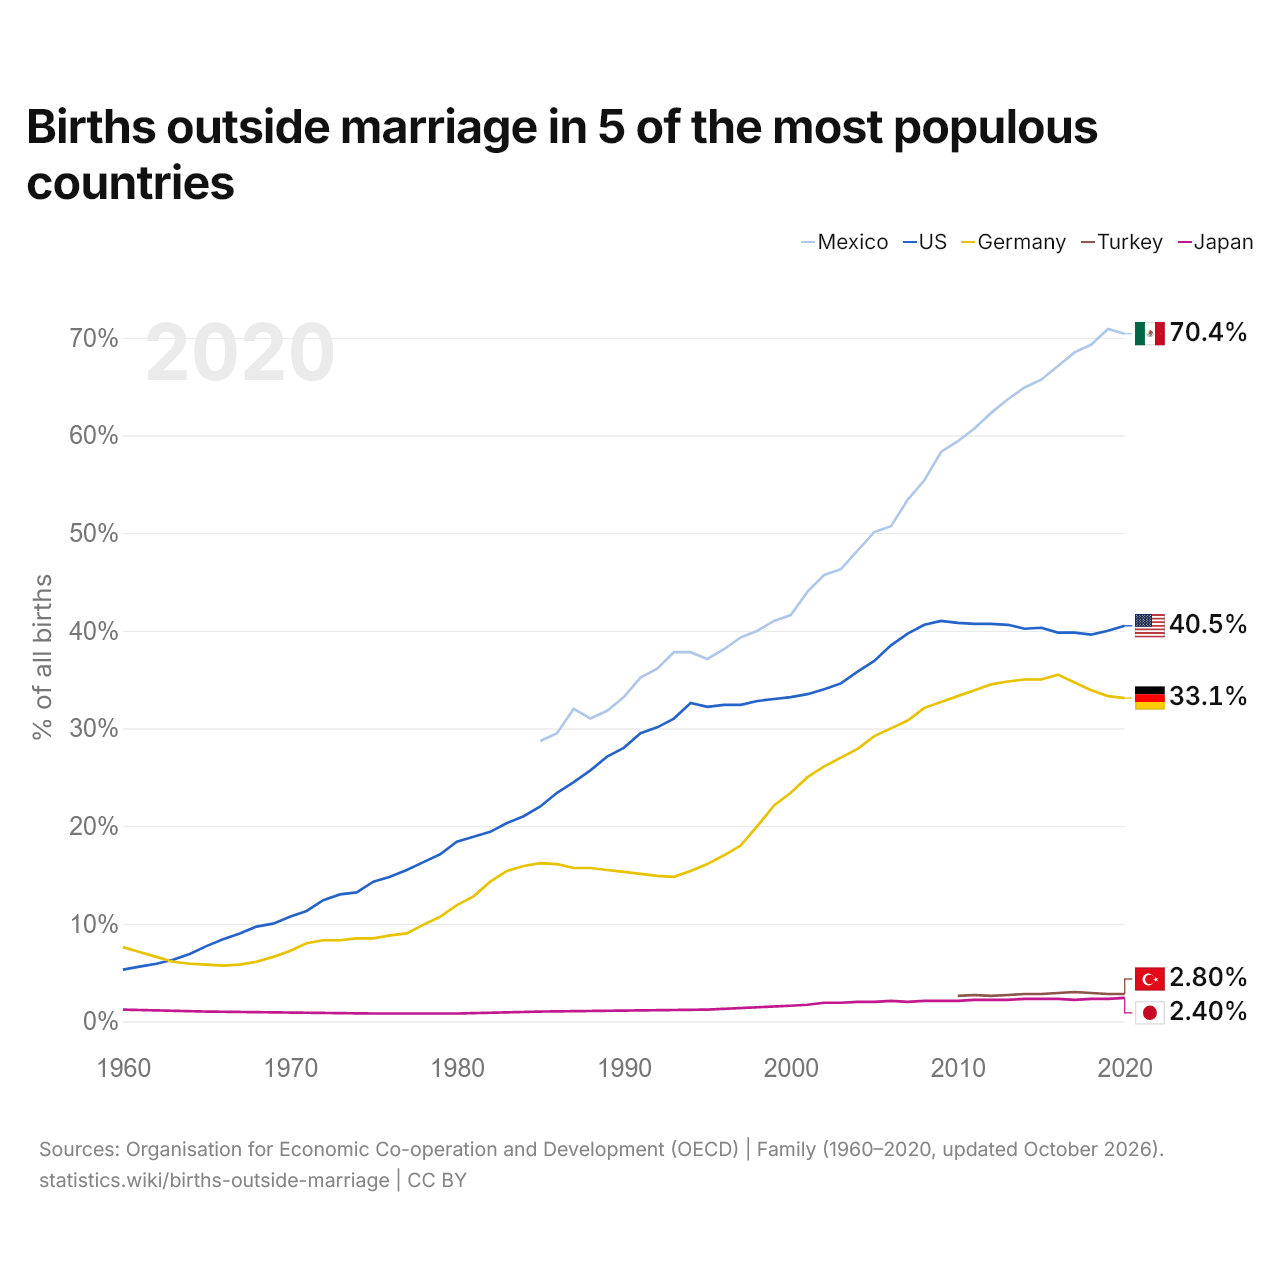
Births outside marriage in 5 of the most populous countries
| Year | % of all births | ||||
|---|---|---|---|---|---|
| Mexico | United States | Germany | Turkey | Japan | |
| 2020 | 70.4% | 40.5% | 33.1% | 2.8% | 2.4% |
| 2019 | 70.9% | 40% | 33.3% | 2.8% | 2.3% |
| 2018 | 69.3% | 39.6% | 33.9% | 2.9% | 2.3% |
| 2017 | 68.5% | 39.8% | 34.7% | 3% | 2.2% |
| 2016 | 67.1% | 39.8% | 35.5% | 2.9% | 2.3% |
| 2015 | 65.7% | 40.3% | 35% | 2.8% | 2.3% |
| 2014 | 64.9% | 40.2% | 35% | 2.8% | 2.3% |
| 2013 | 63.7% | 40.6% | 34.8% | 2.7% | 2.2% |
| 2012 | 62.3% | 40.7% | 34.5% | 2.6% | 2.2% |
| 2011 | 60.7% | 40.7% | 33.9% | 2.7% | 2.2% |
| 2010 | 59.4% | 40.8% | 33.3% | 2.6% | 2.1% |
| 2009 | 58.3% | 41% | 32.7% | - | 2.1% |
| 2008 | 55.4% | 40.6% | 32.1% | - | 2.1% |
| 2007 | 53.4% | 39.7% | 30.8% | - | 2% |
| 2006 | 50.7% | 38.5% | 30% | - | 2.1% |
| 2005 | 50.1% | 36.9% | 29.2% | - | 2% |
| 2004 | 48.2% | 35.8% | 27.9% | - | 2% |
| 2003 | 46.3% | 34.6% | 27% | - | 1.9% |
| 2002 | 45.7% | 34% | 26.1% | - | 1.9% |
| 2001 | 44% | 33.5% | 25% | - | 1.7% |
| 2000 | 41.6% | 33.2% | 23.4% | - | 1.6% |
| 1999 | 41% | 33% | 22.1% | - | - |
| 1998 | 40% | 32.8% | 20% | - | - |
| 1997 | 39.3% | 32.4% | 18% | - | - |
| 1996 | 38.1% | 32.4% | 17% | - | - |
| 1995 | 37.1% | 32.2% | 16.1% | - | 1.2% |
| 1994 | 37.8% | 32.6% | 15.4% | - | - |
| 1993 | 37.8% | 31% | 14.8% | - | - |
| 1992 | 36.1% | 30.1% | 14.9% | - | - |
| 1991 | 35.2% | 29.5% | 15.1% | - | - |
| 1990 | 33.2% | 28% | 15.3% | - | 1.1% |
| 1989 | 31.8% | 27.1% | 15.5% | - | - |
| 1988 | 31% | 25.7% | 15.7% | - | - |
| 1987 | 32% | 24.5% | 15.7% | - | - |
| 1986 | 29.5% | 23.4% | 16.1% | - | - |
| 1985 | 28.7% | 22% | 16.2% | - | 1% |
| 1984 | - | 21% | 15.9% | - | - |
| 1983 | - | 20.3% | 15.4% | - | - |
| 1982 | - | 19.4% | 14.3% | - | - |
| 1981 | - | 18.9% | 12.8% | - | - |
| 1980 | - | 18.4% | 11.9% | - | 0.8% |
| 1979 | - | 17.1% | 10.7% | - | - |
| 1978 | - | 16.3% | 9.9% | - | - |
| 1977 | - | 15.5% | 9% | - | - |
| 1976 | - | 14.8% | 8.8% | - | - |
| 1975 | - | 14.3% | 8.5% | - | 0.8% |
| 1974 | - | 13.2% | 8.5% | - | - |
| 1973 | - | 13% | 8.3% | - | - |
| 1972 | - | 12.4% | 8.3% | - | - |
| 1971 | - | 11.3% | 8% | - | - |
| 1970 | - | 10.7% | 7.2% | - | 0.9% |
| 1969 | - | 10% | 6.6% | - | - |
| 1968 | - | 9.7% | 6.1% | - | - |
| 1967 | - | 9% | 5.8% | - | - |
| 1966 | - | 8.4% | 5.7% | - | - |
| 1965 | - | 7.7% | 5.8% | - | 1% |
| 1964 | - | 6.9% | 5.9% | - | - |
| 1963 | - | 6.3% | 6.1% | - | - |
| 1962 | - | 5.9% | 6.6% | - | - |
| 1961 | - | 5.6% | 7.1% | - | - |
| 1960 | - | 5.3% | 7.6% | - | 1.2% |
Among the five countries, the latest share of births outside marriage is highest in Mexico, 70.4%, and lowest in Japan, 2.4%. The largest change is in Mexico, where it has risen from 28.7% in 1985 to 70.4%.
Compare births outside marriage in any 2 countries
Sources:
- Organisation for Economic Co-operation and Development (OECD) | Family (1960–2021, updated October 2026)
Creative Commons Attribution (CC BY): you may copy, share, adapt and reuse this content, also commercially, as long as you credit statistics.wiki and note any changes you made. The sources listed above may have their own license terms.