
Samoa average age of mothers, 1960–2026
| Year | Age | World rank |
|---|---|---|
| At childbirth | ||
| 2026 projected | 29.1 | #95 |
| 2025 projected | 29.2 | #92 |
| 2024 | 29.2 | #88 |
| 2023 | 29.3 | #81 |
| 2022 | 29.3 | #81 |
| 2021 | 29.3 | #81 |
| 2020 | 29.4 | #81 |
| 2019 | 29.4 | #81 |
| 2018 | 29.4 | #77 |
| 2017 | 29.5 | #73 |
| 2016 | 29.5 | #69 |
| 2015 | 29.6 | #64 |
| 2014 | 29.6 | #61 |
| 2013 | 29.7 | #58 |
| 2012 | 29.7 | #58 |
| 2011 | 29.8 | #55 |
| 2010 | 29.9 | #50 |
| 2009 | 29.9 | #47 |
| 2008 | 29.9 | #42 |
| 2007 | 30 | #38 |
| 2006 | 30 | #33 |
| 2005 | 30 | #31 |
| 2004 | 30 | #30 |
| 2003 | 30 | #31 |
| 2002 | 30.1 | #29 |
| 2001 | 30 | #30 |
| 2000 | 30 | #32 |
| 1999 | 30 | #33 |
| 1998 | 30 | #31 |
| 1997 | 30 | #31 |
| 1996 | 30.1 | #27 |
| 1995 | 30.1 | #24 |
| 1994 | 30.1 | #23 |
| 1993 | 30.2 | #21 |
| 1992 | 30.2 | #22 |
| 1991 | 30.3 | #22 |
| 1990 | 30.2 | #22 |
| 1989 | 30.2 | #24 |
| 1988 | 30.2 | #24 |
| 1987 | 30.1 | #24 |
| 1986 | 30.1 | #25 |
| 1985 | 30.1 | #22 |
| 1984 | 30.1 | #23 |
| 1983 | 30.1 | #24 |
| 1982 | 30.1 | #24 |
| 1981 | 30.1 | #25 |
| 1980 | 30 | #25 |
| 1979 | 30 | #27 |
| 1978 | 30 | #28 |
| 1977 | 30 | #28 |
| 1976 | 30 | #27 |
| 1975 | 30 | #27 |
| 1974 | 30 | #29 |
| 1973 | 30 | #34 |
| 1972 | 29.9 | #35 |
| 1971 | 29.9 | #34 |
| 1970 | 29.9 | #35 |
| 1969 | 29.8 | #41 |
| 1968 | 29.8 | #43 |
| 1967 | 29.7 | #47 |
| 1966 | 29.7 | #49 |
| 1965 | 29.6 | #54 |
| 1964 | 29.5 | #59 |
| 1963 | 29.5 | #59 |
| 1962 | 29.4 | #64 |
| 1961 | 29.4 | #68 |
| 1960 | 29.4 | #73 |
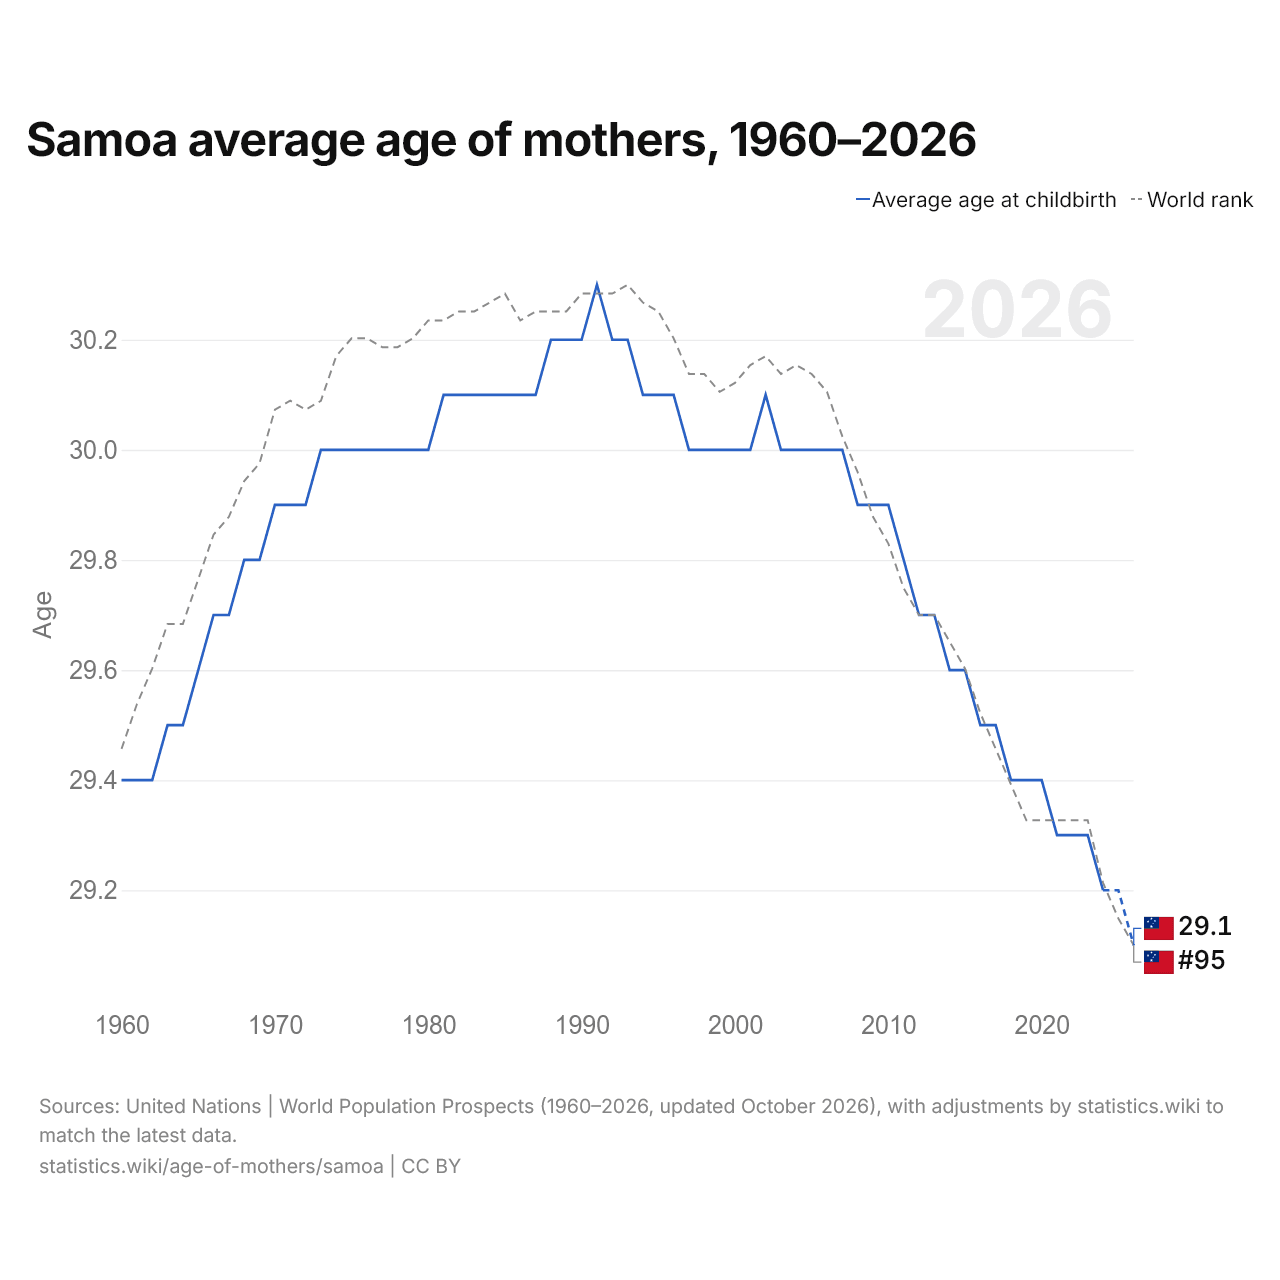
In 2026, Samoa's average age of mothers at childbirth is 29.1 years, down from 29.4 in 1960. It was highest in 1991, at 30.3. It is the 95th highest in the world, down from 92nd in 2025. Its highest rank was 21st, last held in 1993.
Samoa's average age of mothers at childbirth is the 6th highest of the 13 countries of Oceania, where it ranges from the Marshall Islands' and Nauru's 27.1 to Australia's 31.6. The largest ten-year fall in Samoa's average age of mothers was from 2010 to 2020, by 0.5 years; the largest ten-year rise was from 1960 to 1970, by 0.5.
Samoa births by age of the mother, 1960–2026
| Year | Share of births | ||
|---|---|---|---|
| Aged 15–19 | Aged 20–29 | Aged 30+ | |
| 2026 projected | 9.5% | 53.9% | 36.6% |
| 2025 projected | 9.1% | 53.9% | 37% |
| 2024 | 8.7% | 54% | 37.3% |
| 2023 | 8.2% | 54.1% | 37.7% |
| 2022 | 7.8% | 54.6% | 37.6% |
| 2021 | 7.4% | 55.3% | 37.3% |
| 2020 | 7.4% | 55.6% | 37% |
| 2019 | 7.7% | 55.7% | 36.7% |
| 2018 | 7.8% | 55.5% | 36.7% |
| 2017 | 7.8% | 55.3% | 36.9% |
| 2016 | 7.9% | 55% | 37.1% |
| 2015 | 8.3% | 54.4% | 37.4% |
| 2014 | 8.5% | 53.8% | 37.8% |
| 2013 | 8.5% | 53.1% | 38.4% |
| 2012 | 8.5% | 52.5% | 38.9% |
| 2011 | 7.8% | 52.5% | 39.7% |
| 2010 | 7.5% | 52.4% | 40.2% |
| 2009 | 7.2% | 52% | 40.8% |
| 2008 | 6.8% | 51.7% | 41.4% |
| 2007 | 6.6% | 51.4% | 42% |
| 2006 | 6.5% | 51.7% | 41.8% |
| 2005 | 6.5% | 51.7% | 41.8% |
| 2004 | 6.6% | 51.5% | 41.8% |
| 2003 | 6.6% | 51.6% | 41.8% |
| 2002 | 6.6% | 52.2% | 41.3% |
| 2001 | 6.4% | 53.6% | 40% |
| 2000 | 6.5% | 54.7% | 38.8% |
| 1999 | 6.8% | 55.2% | 38% |
| 1998 | 7.1% | 55.5% | 37.3% |
| 1997 | 7.5% | 55.6% | 36.9% |
| 1996 | 7.8% | 55.5% | 36.7% |
| 1995 | 8.2% | 55.4% | 36.5% |
| 1994 | 8.5% | 55.1% | 36.3% |
| 1993 | 8.8% | 55% | 36.2% |
| 1992 | 8.9% | 54.9% | 36.2% |
| 1991 | 8.6% | 55.6% | 35.8% |
| 1990 | 8.6% | 56.5% | 34.9% |
| 1989 | 8.9% | 57% | 34.1% |
| 1988 | 9.2% | 57.3% | 33.4% |
| 1987 | 9.6% | 57.4% | 33% |
| 1986 | 9.6% | 58% | 32.3% |
| 1985 | 9.7% | 58.7% | 31.6% |
| 1984 | 9.9% | 59.1% | 31% |
| 1983 | 9.9% | 59.2% | 30.9% |
| 1982 | 10% | 58.9% | 31.1% |
| 1981 | 9.8% | 58.5% | 31.7% |
| 1980 | 9.7% | 57.8% | 32.4% |
| 1979 | 9.7% | 57% | 33.3% |
| 1978 | 9.6% | 56.1% | 34.3% |
| 1977 | 9.4% | 55.3% | 35.3% |
| 1976 | 8.8% | 55.3% | 35.9% |
| 1975 | 8.3% | 55.2% | 36.4% |
| 1974 | 8.3% | 54.3% | 37.3% |
| 1973 | 8.2% | 53.5% | 38.2% |
| 1972 | 7.9% | 53.5% | 38.6% |
| 1971 | 7.7% | 53.3% | 38.9% |
| 1970 | 8% | 53.1% | 38.9% |
| 1969 | 7.3% | 54.7% | 38.1% |
| 1968 | 6.4% | 56.2% | 37.4% |
| 1967 | 6.2% | 57.1% | 36.7% |
| 1966 | 6% | 57.7% | 36.2% |
| 1965 | 5.9% | 58.5% | 35.6% |
| 1964 | 6.3% | 58.8% | 35% |
| 1963 | 6.4% | 59.2% | 34.4% |
| 1962 | 6.9% | 59.4% | 33.6% |
| 1961 | 7.3% | 59.5% | 33.2% |
| 1960 | 7.6% | 59.6% | 32.8% |
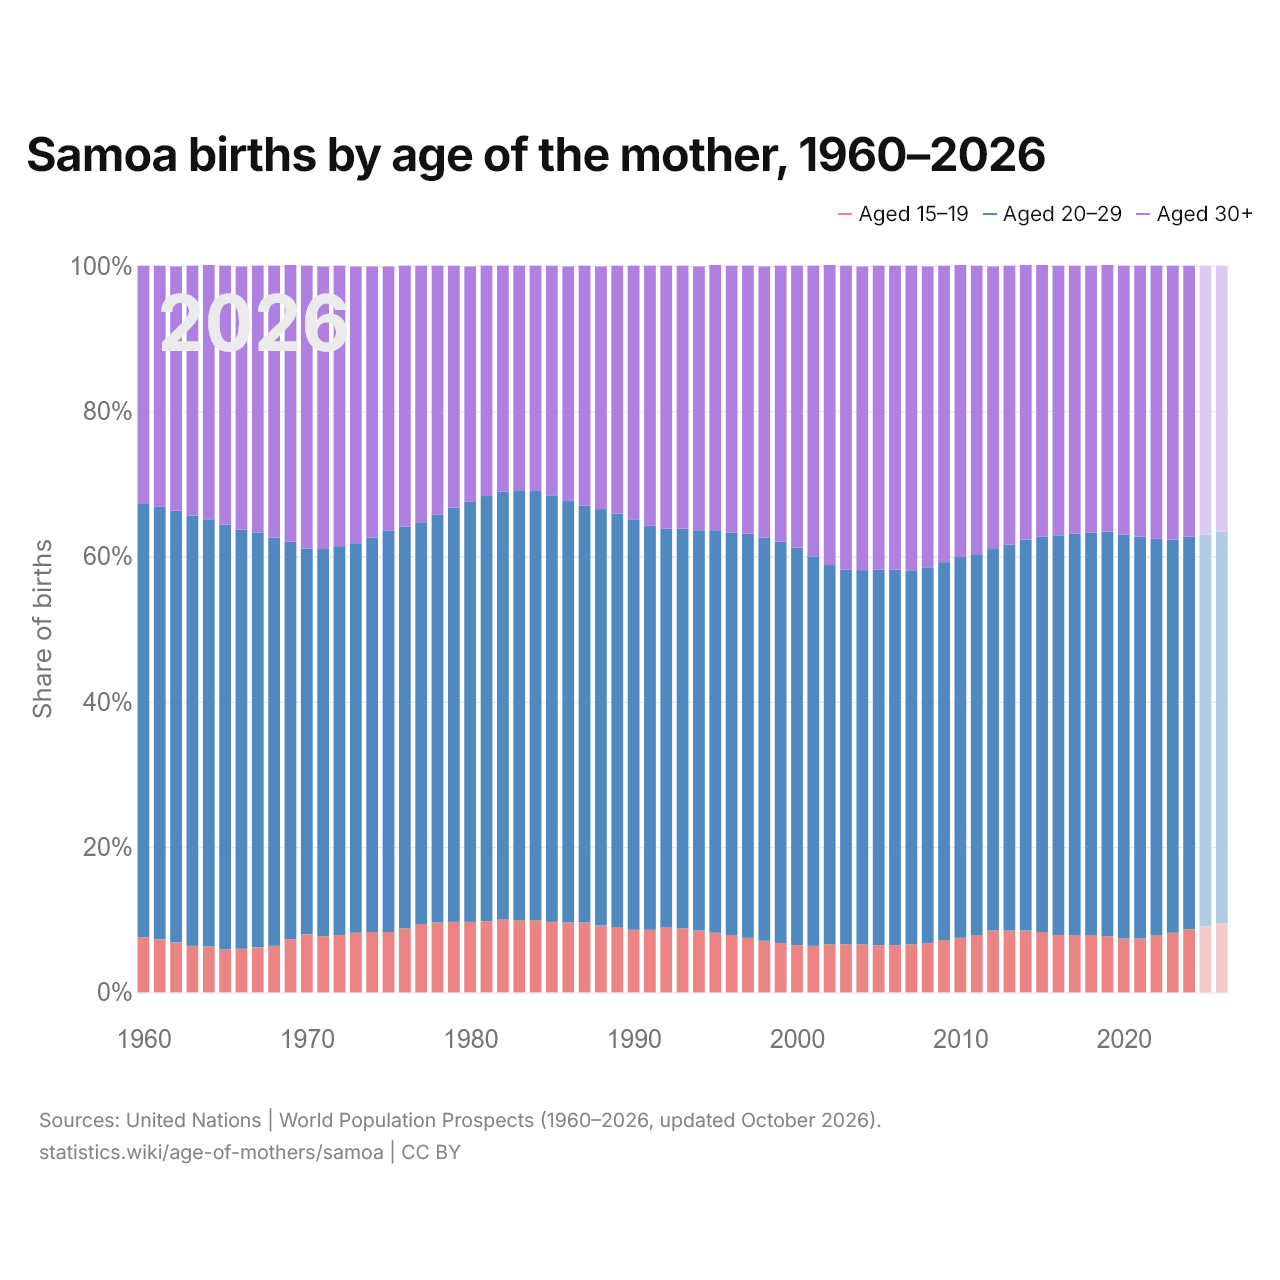
In 2026, 36.6% of births in Samoa are to mothers aged 30 and over, 53.9% to mothers aged 20–29 and 9.5% to mothers aged 15–19. In 1960, the shares were 32.8%, 59.6% and 7.6%.
Samoa in the world ranking by average age of mothers, 2026
| Rank | Country | At childbirth | At first birth | Change since 1990 | |
|---|---|---|---|---|---|
| 92 |
 East Timor |
29.2 | – | −1.8 | |
| 93 |
 Papua New Guinea |
29.2 | – | −0.8 | |
| 94 |
 Nigeria |
29.1 | – | −0.2 | |
| 95 |
 Samoa |
29.1 | – | −1.1 | |
| 96 |
 Solomon Islands |
29.1 | – | −0.6 | |
| 97 |
 Kazakhstan |
29.1 | 29.5 (2021) | +2.7 | |
| 98 |
 Burkina Faso |
29.1 | – | −0.6 |
Compare the average age of mothers in Samoa with other countries
Sources:
- United Nations | World Population Prospects (1960–2026, updated October 2026), with adjustments by statistics.wiki to match the latest data
- United Nations Economic Commission for Europe (UNECE) (2021, updated October 2026)
Creative Commons Attribution (CC BY): you may copy, share, adapt and reuse this content, also commercially, as long as you credit statistics.wiki and note any changes you made. The sources listed above may have their own license terms.